
Markets & Market Intelligence
Stock Market Prediction for Monday (5 Oct 2026): Nifty, Bank Nifty & Sensex Outlook
Indian stock market prediction for Monday, 5 October 2026: Nifty, Bank Nifty and Sensex outlook with the latest Open Interest positioning, key support and resistance levels after the October 1 trading session.

Last Updated: October 1, 2026 | Valid for Monday, October 5, 2026
Market Data Reference: This outlook uses the completed Indian market session of Thursday, October 1, 2026, the latest verified FII/DII cash-market data available at preparation, and the current Nifty and Bank Nifty Open Interest screenshots supplied at 6:08–6:09 PM IST on October 2, 2026. Friday, October 2, 2026 was a market holiday for Gandhi Jayanti.
Contents
Introduction
Hello friends. We are coming into Monday after another sharp deterioration in the Indian market. Nifty closed at 22,421.95, Bank Nifty at 54,450.75 and Sensex at 71,909.70 on Thursday. The bigger point is that Nifty and Sensex have now completed eight consecutive weekly declines — the longest such losing run in roughly 25 years.
What I am interested in now is not simply whether the market is oversold. After Thursday's close, the more useful question is whether we are seeing the first stage of a tradable base or simply another pause inside a strong downtrend. Monday matters because the holiday gives the market a longer weekend, while the latest derivatives positioning is already showing heavy Call supply around the next recovery zones.Where is the smart money positioned, and how should you prepare for the next trading session?
To build consistency, I always recommend combining price structure with derivatives data, as I detail in our guide on how to analyse Nifty and Bank Nifty to build an options trading plan.
Indian Stock Market Weekly Review

Let’s look at what the market gave us this week. Nifty fell 0.88% on Thursday to close at 22,421.95, while Bank Nifty slipped 0.33% to 54,450.75 and Sensex fell 0.79% to 71,909.70. Compared with Friday, September 25, Nifty lost about 3.10% for the week, Sensex about 2.69% and Bank Nifty about 2.03%.
The important part is that this was not just a one-day expiry shock. The market weakened across several sessions, and Thursday's decline came with broad selling while IT was one of the few major pockets of strength. That tells me the pressure is still broader than a single sector or a single expiry event.
Thursday also left us with a very important technical reference: Nifty touched 22,217.30, only a short distance above its reported 52-week low near 22,182.55. Sensex touched 71,292.88, while Bank Nifty traded down to 54,066.60. When an index closes close to the day's low after an already weak multi-week trend, I treat any Monday bounce as guilty until price proves otherwise.
For Monday, I want to see whether buyers can first defend the recent lows and then reclaim the nearest recovery hurdles. For Nifty, 22,300–22,500 is the first area I care about, with 23,000 acting as the larger option-defined ceiling. If price cannot reclaim even the first band and instead breaks the 22,200–22,000 area, I would not try to call a bottom simply because the market looks oversold. The trading framework should remain confirmation-first.
What Drove the Market This Week?
Three developments shaped this week's move, and each one matters because it changes how much conviction I would attach to a Monday bounce.
- First, crude remained elevated around the $100 area even after some fluctuations. That matters for India because imported energy costs feed into inflation, the rupee and the broader cost of capital. The market is therefore dealing with a macro headwind, not just a technical correction.
- Second, global bond yields stayed uncomfortable. The U.S. 10-year yield was around 5.3%, while Indian equities were also dealing with continued foreign selling. That combination makes it harder for a weak market to generate a clean valuation-led recovery.
- Third, Thursday showed that sellers still had the upper hand. There were pockets of strength in IT, but the broader market remained weak and the major indices closed near the lower end of their ranges. For Monday, I therefore need to see a change in price behaviour, not just a softer opening or a few oversold readings.
I explored how liquidity and positioning behave during sharp turns in what a rapid recovery can tell us about market strength.
What could change this outlook before Monday's open?
The first thing I will watch over the long weekend is crude and the global bond market. If oil or Treasury yields move sharply higher again, the pressure on the rupee and Indian equities can return immediately at Monday's open.
The second factor is the currency. The rupee was around the 96-per-dollar area, and continued FII selling has kept that pressure visible. I do not need the rupee to become strongly bullish for Monday, but I do want to see the macro pressure stop accelerating if a relief rally is going to hold.
That is why I am not building Monday's plan around a fixed prediction. I want price, breadth and fresh OI changes to agree. If Nifty reclaims 22,500 and then starts absorbing the 22,650–23,000 Call supply, the recovery case improves. If it stays below those levels and breaks 22,200–22,000, I would continue treating rallies as tactical rather than structural.
FII & DII Analysis
The latest verified cash-market institutional flow available at preparation is from October 1. FIIs were net sellers of about ₹9,484 crore, while DIIs bought about ₹10,042 crore. On September 30, FIIs sold about ₹10,148 crore while DIIs bought about ₹11,272 crore. On September 29, FIIs sold about ₹9,980 crore while DIIs bought about ₹6,953 crore.
What does this tell you for Monday?
Domestic institutions are still absorbing a very large amount of foreign selling, but the scale of the FII outflow is now important enough that I would not interpret DII buying as a standalone bullish signal. Across September 25 and the four sessions through October 1, the verified flow numbers point to roughly ₹38,659 crore of FII selling against about ₹36,294 crore of DII buying.
For the trading plan, the confirmation I need is still price behaviour at the major support and resistance zones. If DII support continues and Nifty reclaims 22,500–22,650 while Bank Nifty starts holding above 55,000, the recovery case becomes more credible. If FIIs remain aggressive sellers and price loses the recent lows, the flow data is telling us that domestic demand is absorbing supply rather than reversing the trend.
Nifty Option Chain Analysis
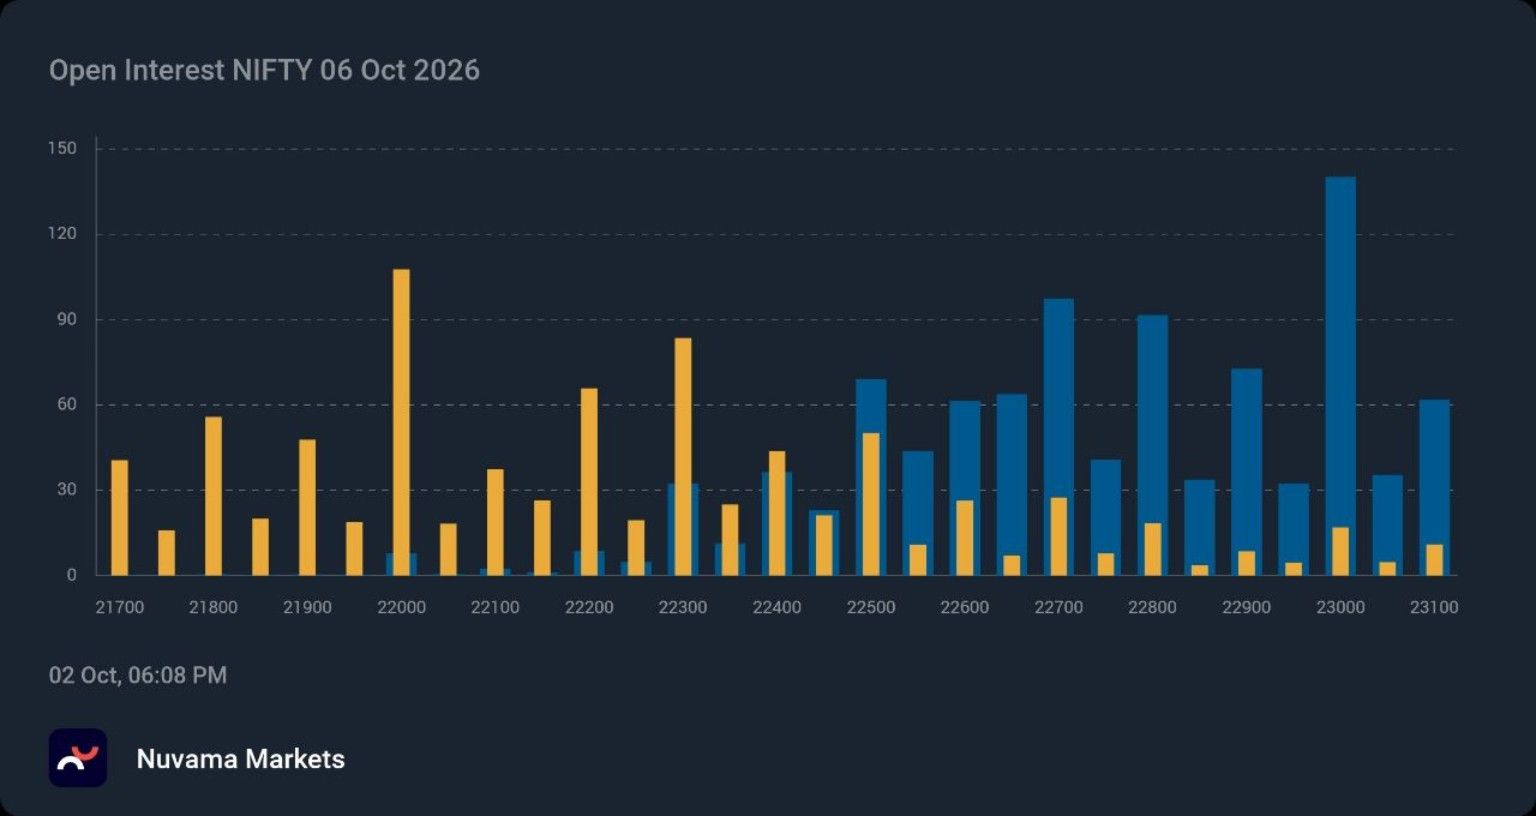
Let’s look at the latest Nifty positioning for the 6 October 2026 weekly expiry. The supplied 6:08 PM IST screenshot shows Nifty at 22,421.95 with a clear concentration of Put OI around 22,000 and 22,300, while Call OI is much heavier from 22,600 upward, with particularly large concentrations around 22,700–23,000. The latest verified chain PCR is about 0.685, so the overall structure remains Call-heavy.
The practical message is that 22,300–22,000 is the first downside positioning band, while 22,500 is the transition point before the heavier Call OI concentration begins. Above that, 22,700–23,000 is the major supply zone visible in the screenshot, with the largest Call concentration around 23,000.
The important change is the way the current chain is stacked around spot. Put OI is concentrated below the market around 22,000–22,300, while Call OI builds aggressively above 22,600. That tells me Monday has a clearly defined decision map: defend 22,300–22,000 on the downside, then prove strength through 22,500 and 22,700 before 23,000 can become a realistic recovery target.
For Monday, 22,300–22,000 is the downside decision band. If buyers defend that zone and price reclaims 22,500, I will then watch 22,700 and 23,000 for evidence that the heavy Call positioning is being absorbed or unwound. If price rejects the recovery zone and breaks 22,200, the safer framework is to respect the downside structure rather than forcing a reversal trade.
If you prefer structured, risk-capped strategies in this environment, explore our framework for a defined-risk Nifty options strategy.
Bank Nifty Option Chain Analysis
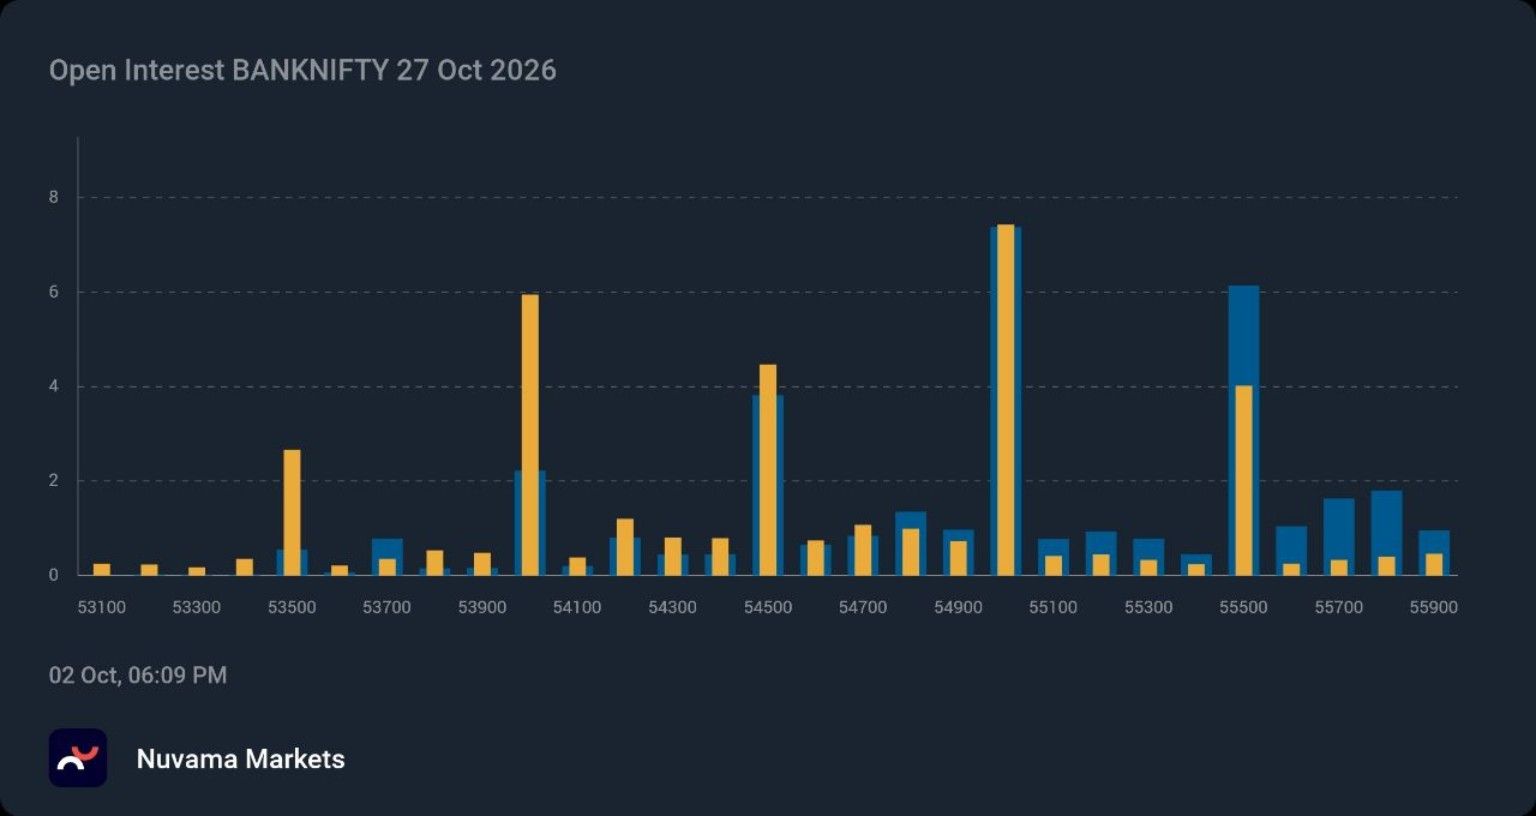
For Bank Nifty, the supplied 6:09 PM IST screenshot is for the 27 October 2026 monthly expiry. With Bank Nifty at 54,450.75, the visible Call OI is concentrated around 54,500 and especially 55,000–55,500, while Put OI is strongest around 53,500–54,500, with 54,000 standing out as an important downside reference. The latest verified PCR is about 0.865.
The practical message is clearer than the ratio alone. The market is sitting just above the 54,000 Put concentration, while the first meaningful Call supply appears around 54,500 and becomes heavier at 55,000–55,500. That gives Monday a compact decision range: 54,000 is the key downside reference, while 55,000–55,500 is the recovery test.
Below spot, 54,000 is the first important Put-OI reference, followed by 53,500. On the upside, 54,500 is the first nearby Call concentration and 55,000–55,500 is the heavier overhead zone visible in the screenshot. I therefore want to see sustained acceptance above 55,000 before treating a Bank Nifty bounce as more than a short-covering move.
My Monday framework is therefore simple: if Bank Nifty can reclaim 55,000 and then hold 55,500, I will look for a move toward 56,000. If it remains below 55,000 and loses 54,000, the downside structure remains vulnerable toward 53,500. The monthly PCR is useful context, but the fresh price/OI interaction around these visible concentrations matters more than the ratio alone.hedged versus naked option strategies to keep your risk defined.
Sensex Option Chain Analysis

For Sensex, the latest verified 8 October 2026 weekly option structure shows a PCR of about 0.892, down from 1.093 previously. The maximum Call OI is at 72,500, while the largest Put OI is at 67,000, with another important Put concentration around 70,000. This tells me the near-term chain has become more defensive as Sensex has fallen toward 72,000.
Thursday's close at 71,909.70 and the intraday low of 71,292.88 make 71,300 the first price reference. Below that, 70,000 becomes the more meaningful option-defined downside level. The chain also shows fresh Put addition around 72,000, but that level is currently above spot, so I want to see whether it actually turns into support rather than assuming the OI is automatically bullish.
On the upside, 72,500 is the clearest Call wall and also the reported max-pain level. So 72,500 is the first meaningful recovery hurdle for Monday. A move through it with Call unwinding would improve the short-term structure; repeated rejection there would keep the market trapped in the broader downtrend.
So for Monday, I will read Sensex together with Nifty and Bank Nifty. If all three reclaim their first recovery hurdles, the breadth of the move improves. If Sensex remains below 72,500 and then loses 71,300, the heavier downside structure remains intact and I would keep the recovery thesis on hold.
Nifty Prediction for Monday
Here is how I would frame the Nifty plan for Monday: 22,300–22,000 is the first downside decision band because the supplied 6:08 PM option-chain screenshot shows the strongest Put positioning around 22,000 and 22,300. The recovery side starts at 22,500, after which the heavier Call OI from 22,700 toward 23,000 becomes the next test.
- In a bullish scenario, I want to see sustained acceptance above 22,500 and then 22,650 before treating the move as a genuine recovery attempt. If those levels are absorbed, 23,000 becomes the next major test; otherwise the bounce remains tactical.
- In a bearish scenario, if Nifty loses 22,300 and then 22,200, the market can retest 22,000 and potentially the recent low near 22,217.30. A break of 22,000 would materially weaken the idea that the market is building a near-term floor.
Bank Nifty Prediction for Monday
Bank Nifty's Monday playbook begins with 54,000 on the downside and 55,000 on the recovery side. The supplied 6:09 PM option-chain screenshot shows Put concentration around 54,000–54,500 and heavier Call concentration around 55,000–55,500. Thursday's close at 54,450.75 leaves the index inside that decision range, so I want to see which side price accepts before increasing conviction.
Conversely, if the index remains below 55,000 and then loses 54,000, the next important downside reference is 53,500. Bank Nifty is one of my confirmation tools here: if banks cannot participate in a recovery through the 55,000–55,500 Call supply zone, I would be much more cautious about treating a Nifty bounce as durable.
Sensex Prediction for Monday
For Sensex, the first question is whether the index can reclaim and hold 72,500, which is the clearest current Call wall and max-pain reference. If it does, 73,000 becomes the next test. If 72,500 fails and the market loses 71,300, the downside map opens toward 70,000.
Key Levels to Watch on Monday
What Traders Should Watch on Monday
Before placing your first trade on Monday morning, I would verify these four checkpoints:
- First, check where crude oil, the dollar and global bond yields are trading after the long weekend. These variables remain important because the latest sell-off was driven by a combination of macro pressure and persistent foreign selling, not simply by chart mechanics.
- Second, observe whether Nifty can defend 22,300–22,000 and whether Bank Nifty can hold 54,000. Those are the downside references I do not want to see lost without a clear change in the underlying flow.
- Third, update the live Open Interest map during the session. For Nifty, Put support around 22,300–22,000 needs to hold while price works through the 22,500–22,700 Call supply zone; for Bank Nifty, acceptance above 55,000 and then 55,500 would matter more than a brief spike through the first level. Fresh Call writing near those levels would do the opposite.
- Fourth, watch breadth and sector participation. Thursday showed how narrow the leadership was, with IT providing relative support while Auto, Metal, Consumer Durables and several other sectors weakened. A sustainable recovery should broaden rather than depend on one defensive pocket.
Want to Trade with More Confidence?
Knowing market levels is useful. Building a repeatable process around risk, execution and market structure is what improves consistency.
Final Verdict
The market enters Monday after another difficult week, with Nifty and Sensex completing eight consecutive weekly declines. Thursday's close near the session lows tells me sellers still have control, while the current derivatives structure is also defensive. There is enough oversold pressure for a relief bounce, but not enough evidence yet to call a durable bottom.
For Monday, I am using Nifty 22,300–22,000 as the first downside decision zone and 22,500–22,650 as the key recovery band. Bank Nifty revolves around 54,000 on the downside and 55,000–55,500 on the recovery side. Sensex has 71,300 as the first downside reference, with 72,500 as the first meaningful recovery hurdle.
Remember, as disciplined traders, our job is not to predict the market blindly, but to react systematically when price interacts with these predefined levels. Thursday's sell-off is information, not confirmation of a bottom. Protect your capital, manage position sizing, and let price plus live OI confirm direction before committing meaningful risk.
Disclaimer: This article is intended solely for educational and informational purposes. The views are based on market structure and publicly available information and should not be construed as investment or trading advice. Trading and investing involve risk; define risk before taking any position.
Replete Equities
This is today's read. Want to know what's actually limiting your own trading?
Get your free Trading Maturity Score in 5 minutes — no card required.