
Markets & Market Intelligence
Stock Market Prediction for Monday (16 Nov 2026): Nifty, Bank Nifty & Sensex Outlook
Indian stock market prediction for Monday, 16 November 2026: Nifty, Bank Nifty and Sensex outlook after Friday's pullback, with weekly performance, latest FII/DII flows, timestamped option-chain positioning and key support/resistance levels.

Last Updated: November 13, 2026 | Valid for Monday, November 16, 2026
Market Data Reference: This outlook uses the completed Indian market session of Friday, November 13, 2026; benchmark closes of Nifty 25,144.30, Sensex 81,592.45 and Bank Nifty 60,998.00; provisional FII/DII cash-market flows available through November 12; and the three Nuvama Markets Open Interest screenshots supplied for November 13. The Nifty screenshot is for the 17 November expiry (spot 25,144.30, PCR 0.83, cumulative Call/Put counters 7.33Cr/6.02Cr, advances 11 and declines 38). The Bank Nifty screenshot is for the 23 November expiry (displayed spot 61,034.10, PCR 1.24, cumulative Call/Put counters 55.78L/49.23L, advances 1 and declines 13; the counters are displayed separately from the PCR). The Sensex screenshot is for the 19 November expiry (spot 81,592.45, PCR 0.91, cumulative Call/Put counters 38.51L/30.49L, advances 7 and declines 23; these counters are also displayed separately from the PCR). The screenshots do not display max-pain values; none are inferred. Strike concentrations are read from the supplied charts, and the broker-displayed spot is reported as shown rather than forced to match the official closing print.
Contents
Introduction
Hello friends. Friday, November 13, was a pullback after a strong run earlier in the week. Nifty closed at 25,144.30, down 0.61%; Sensex settled at 81,592.45, lower by 0.39%; and Bank Nifty finished at 60,998.00, down about 0.85%. Despite Friday's weakness, the week remained positive: Nifty gained roughly 0.46%, Sensex 0.70% and Bank Nifty about 3.24% from their November 6 closes.
What stands out to me is the difference between the headline indices and the banking sector. Nifty and Sensex gave back some ground on Friday, but Bank Nifty still led the week with a gain above 3%. At the same time, October retail inflation came in at 6.09%, above the RBI's 6% upper tolerance level, crude oil moved higher and the rupee weakened. Foreign buying has been unusually strong, but that support is now meeting a more difficult macro backdrop. For Monday, I want to know whether 25,000 can hold in Nifty, whether Bank Nifty can defend 60,500 and absorb supply around 61,000, and whether Sensex can stay above its 81,500 decision zone. Can the recent foreign-led recovery absorb higher inflation and renewed oil pressure, or is Friday's decline the first sign that buyers are becoming more selective near these levels?
To build consistency, I always recommend combining price structure with derivatives data, as I detail in our guide on how to analyse Nifty and Bank Nifty to build an options trading plan.
Indian Stock Market Weekly Review
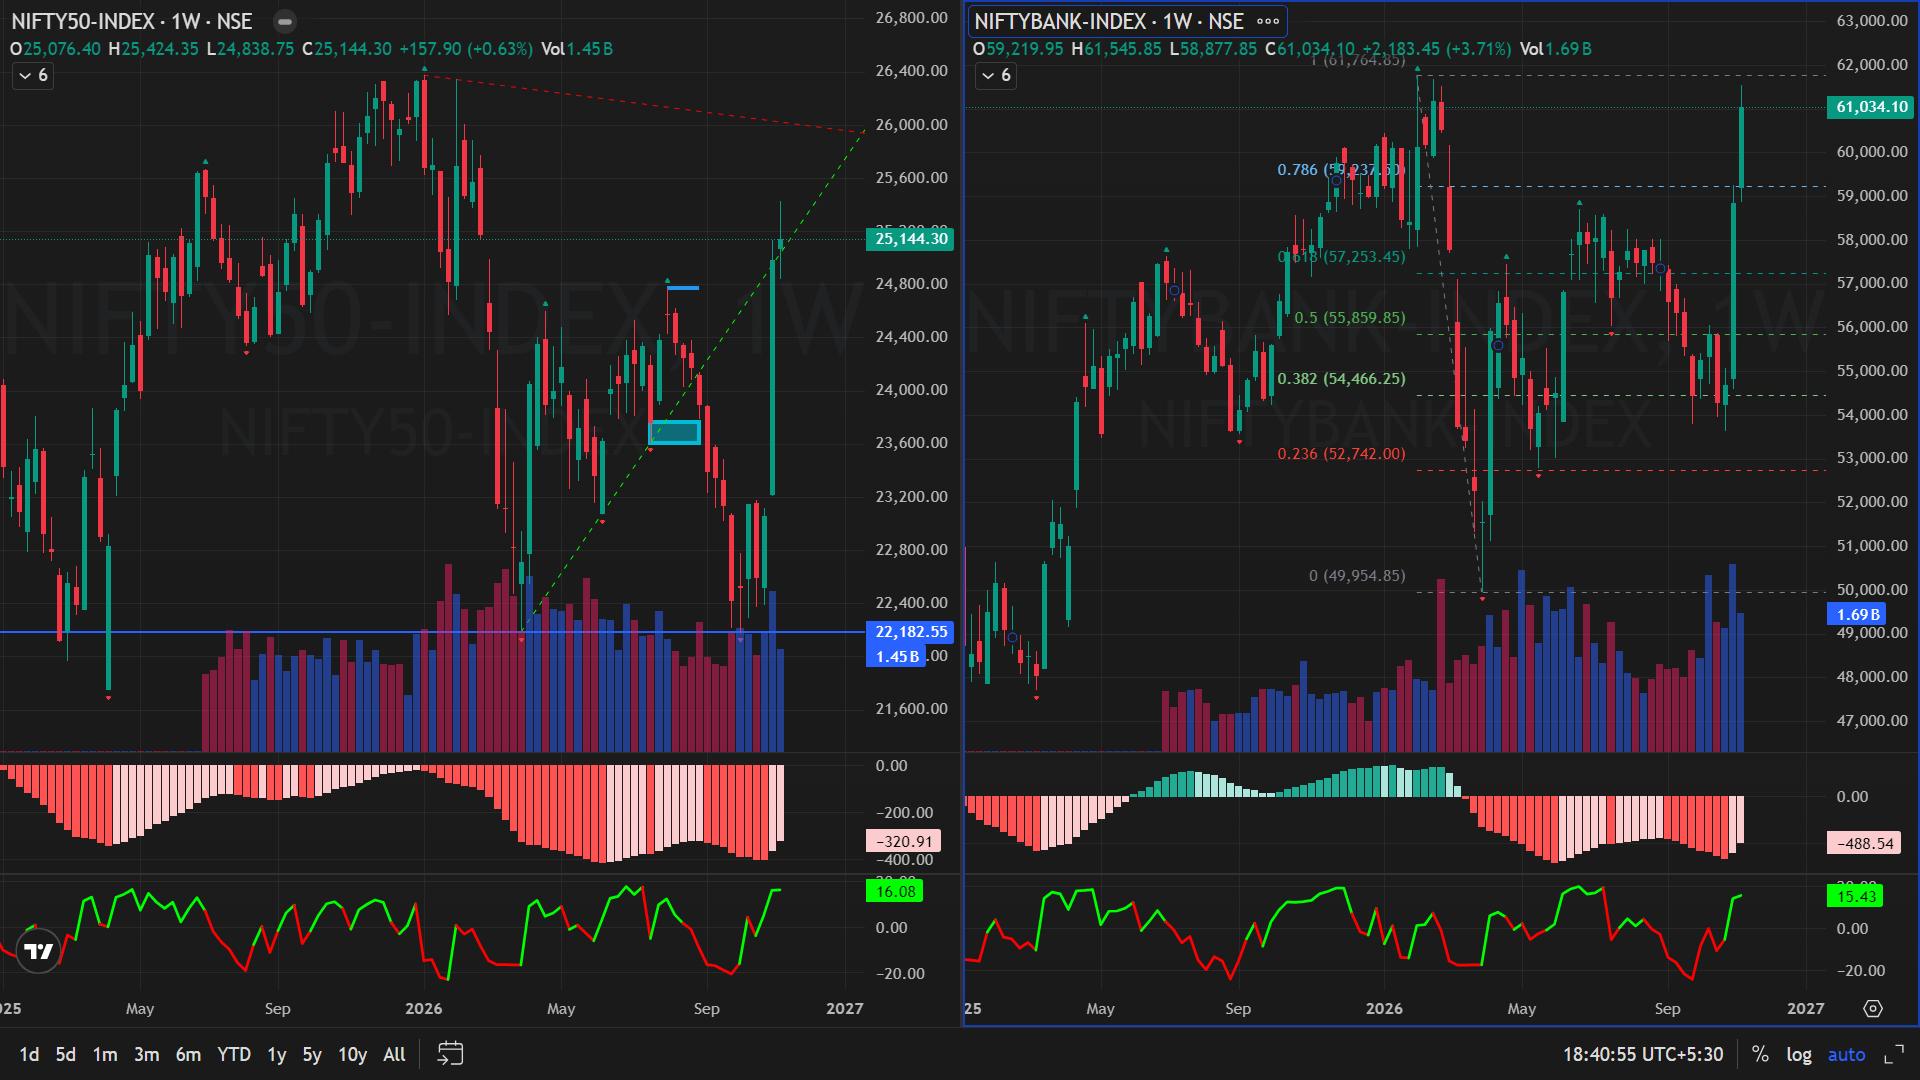
Let’s put the week in perspective. Nifty closed Friday at 25,144.30, about 0.46% above its November 6 close of 25,030.35. Sensex finished at 81,592.45, up roughly 0.70% from 81,028.02. Bank Nifty was the stronger index for the week, closing at 60,998.00 for a gain of approximately 3.24% from 59,086.00. So the weekly picture is not weak, but Friday's decline tells me that the market is no longer moving in one direction without resistance.
Participation remained reasonably healthy over the full week. Reuters reported that 13 of 16 major sectors recorded weekly gains, while mid-caps advanced about 2.1% and small-caps 3.6%. SBI gained around 6% for the week after its results, and Bank Nifty's 3.24% advance shows that financials contributed more than the headline Nifty return suggests. But the rotation inside the market matters: the IT index fell 3.2%, ending a six-week winning run. I read this as a market that still has buyers, but is shifting leadership rather than lifting every sector together. On Monday, I want banks and broader-market breadth to remain supportive before treating a Nifty recovery as durable.
The macro backdrop is the reason I am not dismissing Friday's selling as routine profit-booking. October CPI inflation rose to 6.09% from 5.54% in September, crossing the RBI's 6% upper tolerance band; food inflation reached 8.94%. Crude prices also rose as Middle East tensions continued. The rupee closed around ₹94.24 per US dollar, down about 0.2% on Friday and 0.3% for the week, while India's 10-year government bond yield moved up to around 7.31%. Higher inflation, oil and yields can tighten financial conditions and make rate-sensitive sectors more vulnerable. If these pressures ease, the market can look through them; if they persist, I would expect more selective buying and sharper reactions around resistance.
For Monday, my first map is straightforward: Nifty needs to defend 25,000 and reclaim 25,200–25,300 before 25,500 can come into play. Bank Nifty should hold 60,500–60,000 and reclaim 61,000 first, with 61,500 and 62,000 as the next overhead tests. Sensex needs to stay around 81,500 and work through 82,000. These are decision zones, not promises. Monday also brings the scheduled October WPI release at 12:00 PM IST, so I would avoid treating the opening move as the whole day's direction.
What Drove the Market This Week?
Three forces explain why the indices could finish the week higher but still pull back on Friday. I am looking at foreign flows, the sudden return of inflation and oil risk, and the rotation between sectors because each one changes how much confidence I would place in a Monday breakout.
- First, foreign money continued to come back in size. The latest verified cash-market series shows FIIs bought approximately ₹7,831 crore on November 12, following net buying of about ₹12,563 crore on November 11 and ₹7,212 crore on November 9. Reuters also reported that foreign investors had brought in roughly $8 billion into Indian equities during November, the strongest monthly inflow since December 2020. This is important because the market is no longer relying only on domestic institutions to absorb supply. But Friday's index decline reminds me that strong flows do not prevent short-term profit-taking. I want to see whether foreign buying continues and whether price responds positively to it, rather than treating the flow number as a buy signal by itself.
- Second, the inflation and oil backdrop became more uncomfortable. October CPI rose to 6.09%, above the RBI's 6% upper tolerance band, with food inflation at 8.94%. Brent crude also moved higher as Middle East tensions continued. For India, that combination matters because higher imported energy costs can pressure the rupee, inflation expectations and bond yields. The rupee ended Friday near ₹94.24 per dollar and the 10-year government bond yield rose to about 7.31%. If oil cools and yields stabilise, the market can absorb the inflation surprise; if they continue higher, banks, autos, real estate and other rate-sensitive areas may find it harder to extend the rally.
- Third, sector participation was positive, but leadership rotated. Thirteen of 16 major sectors gained over the week; mid-caps rose about 2.1% and small-caps 3.6%. Bank Nifty added roughly 3.24% and SBI gained around 6% for the week. At the same time, IT fell 3.2% after a six-week advance. That tells me risk appetite is still present, but traders are reallocating rather than buying everything indiscriminately. For Monday, I want banks to hold their relative strength and the broader market to avoid a sharp deterioration. If only a few heavyweights support the indices, I would reduce conviction even if Nifty stays near 25,000.
I explored how liquidity and positioning behave during sharp turns in what a rapid recovery can tell us about market strength.
What could change this outlook before Monday's open?
The first thing I will watch over the weekend is whether crude oil and global bond yields remain elevated. Reuters reported that the rupee weakened on Friday as oil pressure and expectations of a more hawkish Federal Reserve offset strong foreign investment. If oil continues higher and global yields rise further, the market may open cautiously despite the positive weekly close. If crude stabilises and the rupee stops weakening, the foreign-flow support has a better chance of translating into price stability.
The second factor is Monday's domestic data calendar. October WPI inflation is scheduled for release on Monday, November 16, at 12:00 PM IST. After CPI surprised at 6.09%, traders will look at wholesale prices for evidence of whether cost pressure is broadening. Nifty's next weekly expiry is Tuesday, November 17; Sensex weekly expiry is Thursday, November 19; and Bank Nifty's November monthly expiry is scheduled for Monday, November 23. That gives us a normal trading week, but derivatives positioning can still shift quickly as traders prepare for the separate expiries. I will use the WPI release and live OI changes as information, not as a reason to predict a one-way move.
That is why I am not building Monday's plan around an automatic continuation of the weekly recovery. I want Nifty to hold 25,000 and reclaim 25,200–25,300, Bank Nifty to defend 60,500 and then reclaim 61,000 before testing 61,500–62,000, and Sensex to hold 81,500 and test 82,000. If those levels are reclaimed with supportive breadth and the relevant Call OI begins to unwind, the bullish case improves. If Nifty loses 25,000, Bank Nifty breaks 60,500 and Sensex slips below 81,500 while oil and yields remain firm, I would treat Friday's pullback as the start of a deeper consolidation.
FII & DII Analysis
The latest verified provisional cash-market institutional flows available at preparation are through Thursday, November 12; the November 13 figures were not yet available in the source checked. FIIs were net buyers of about ₹7,831 crore on November 12, while DIIs were net sellers of roughly ₹6,331 crore. On November 11, FIIs bought around ₹12,563 crore and DIIs sold about ₹8,435 crore. On November 9, FIIs bought approximately ₹7,212 crore while DIIs sold ₹7,173 crore. On November 6, FIIs bought around ₹13,750 crore and DIIs sold about ₹5,969 crore; on November 5, FIIs bought approximately ₹14,975 crore while DIIs sold ₹10,445 crore. These are provisional cash-market figures, can be revised and do not represent derivatives positioning.
What does this tell you for Monday?
This is a very different flow pattern from the one we were tracking through October. The latest five-session series through November 12 shows FIIs net buyers by approximately ₹56,331 crore, while DIIs were net sellers by roughly ₹38,351 crore. Quantsapp's latest published series also shows FIIs as net buyers for nine consecutive sessions and DIIs as net sellers for nine sessions. The important point is that foreign demand has become the marginal support for this recovery, while domestic institutions have been booking or reallocating. That can keep the index resilient, but it also means I want to monitor whether FII buying persists when inflation, oil and bond yields are moving in the wrong direction. A reversal in foreign flows would matter more if price is already losing its key support zones.
For Monday, I will use flows as confirmation, not as a standalone trade trigger. If FIIs continue buying after Friday's pullback and Nifty holds 25,000 while Bank Nifty defends 60,500, the recovery has a stronger foundation. If foreign buying fades while crude and yields remain elevated and the indices break their first support zones, I would be more cautious about buying dips. DII selling is not automatically bearish, but it tells me that domestic demand is not currently offsetting foreign flows in the same way it did during earlier corrections.
Nifty Option Chain Analysis
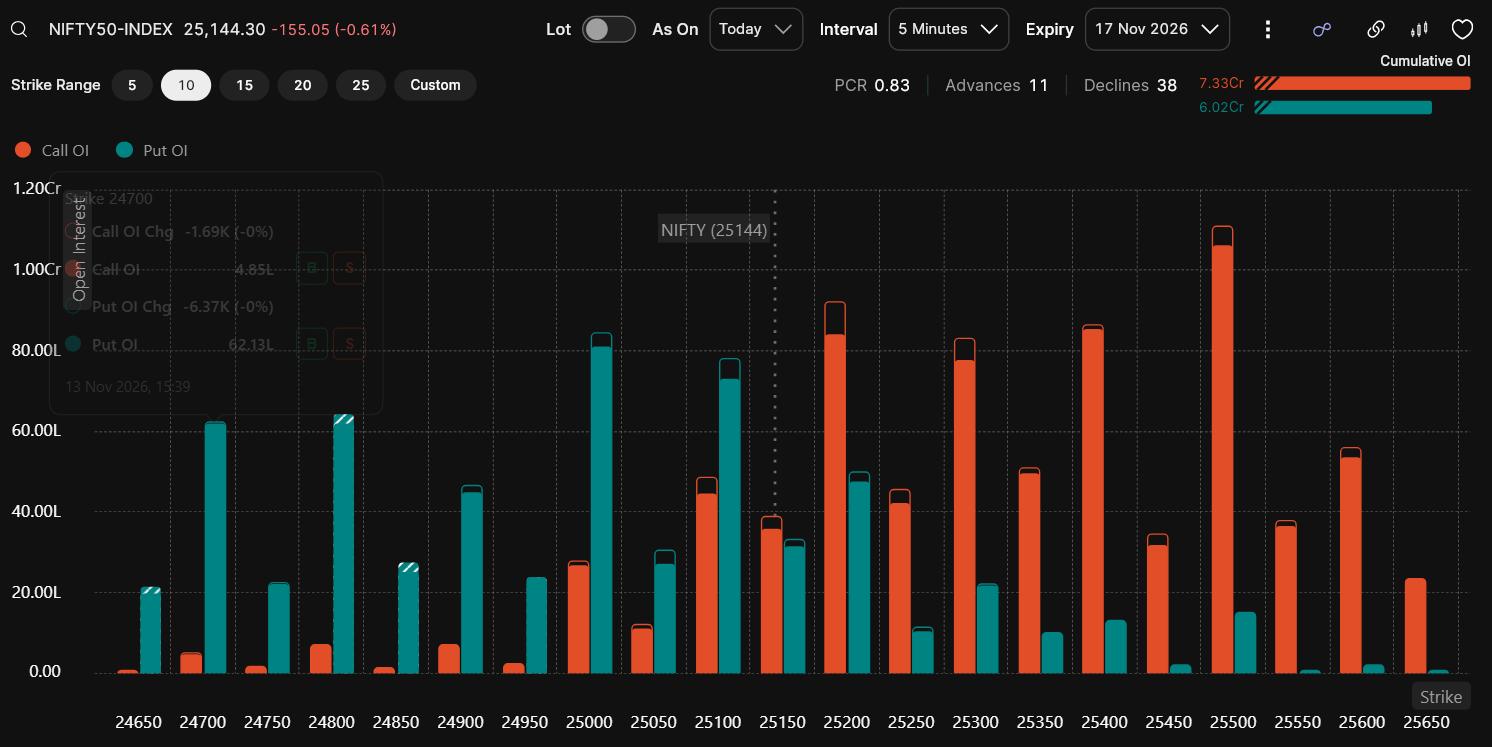
For Nifty, the Nuvama screenshot supplied for the 17 November 2026 weekly expiry shows the index at 25,144.30 and a displayed PCR of 0.83. The header shows cumulative Call OI of 7.33Cr and Put OI of 6.02Cr, with 11 advances against 38 declines. On the strike chart, 25,000 is the largest visible Put-OI concentration, with additional Put interest around 25,100 and 24,700–24,800. On the Call side, 25,500 is the largest visible concentration, while 25,200, 25,300 and 25,400 also carry meaningful supply. That gives me a clear map: 25,000 is the first downside defence, 25,200 is the first overhead hurdle and 25,500 is the larger Call wall. The screenshot does not show max pain, so I am not carrying forward a public max-pain estimate.
The important detail is the combination of positioning and breadth. The displayed PCR is below 1 and the cumulative Call counter is higher than the Put counter, while the screenshot shows only 11 advances against 38 declines. That tells me the Friday pullback was not just a harmless dip in an otherwise uniformly strong market. The 25,000 Put concentration may help absorb selling, but I want to see price hold that strike and breadth improve before treating it as dependable support. On the upside, 25,200–25,500 is a layered supply zone, not one single resistance line.
A PCR of 0.83 tells me the selected weekly chain is positioned with a Call-heavy tilt. It does not automatically predict a fall, but it raises the bar for a clean breakout. If Nifty holds 25,000, breadth improves and Call OI at 25,200–25,500 begins to unwind as price advances, the recovery becomes more convincing. If fresh Call writing builds at those strikes while the index repeatedly fails near 25,200, I would expect a range or another pullback. I will give more weight to the next change in OI and price response than to one PCR reading.
My working framework is to treat 25,000 as the first pivot, with 24,800 and 24,700 as the next downside references. On the upside, 25,200 is the first hurdle, 25,300 is the next test and 25,500 carries the largest visible Call OI. If buyers defend 25,000, breadth improves and supply above 25,300 is absorbed, the trend can extend towards 25,500. If 25,000 fails and Put OI begins to unwind, I would stop treating the nearby Put concentration as a cushion and reassess the long-side setup.
If you prefer structured, risk-capped strategies in this environment, explore our framework for a defined-risk Nifty options strategy.
Bank Nifty Option Chain Analysis
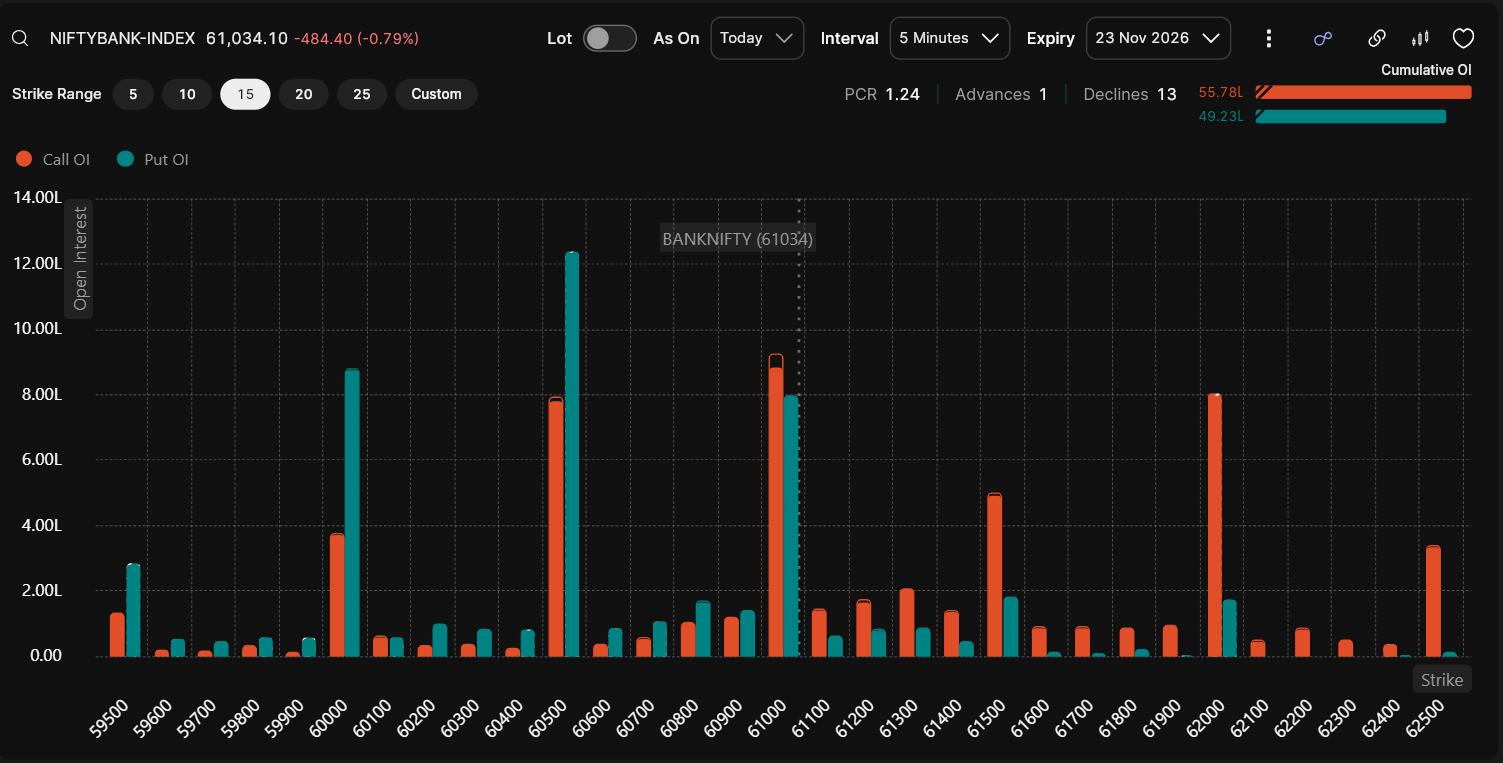
For Bank Nifty, the Nuvama screenshot supplied for the 23 November 2026 expiry shows the underlying at 61,034.10 and a displayed PCR of 1.24. The strike distribution is more useful than the headline ratio: the strongest visible Put concentration is at 60,500, followed by 60,000 and 61,000; the largest Call concentration is at 61,000, with another major Call cluster at 62,000 and additional supply at 60,500 and 61,500. The screenshot's cumulative counters show 55.78L Call and 49.23L Put, but they are displayed separately from the PCR and I will not use them to recalculate or reinterpret the platform ratio. The screenshot also shows 1 advance against 13 declines. No max-pain value is displayed. The broker spot is 61,034.10; the official Friday close used in the market review remains 60,998.00.
The key takeaway is that 61,000 is not a distant resistance level — it is the largest visible Call-OI strike and sits almost exactly at the screenshot's underlying level. That makes it the first supply test on Monday. On the downside, 60,500 has the strongest visible Put concentration and is the first level I want to see defended; 60,000 is the next meaningful reference. PCR at 1.24 is supportive on its face, but the very weak displayed breadth and the separate cumulative counters mean I would not call this an uncomplicated bullish setup.
Below spot, I would first watch 60,500, followed by 60,000. The 60,500 Put concentration is the nearest major downside reference, but it is not a guarantee that buyers will defend it. On the upside, 61,000 is the first hurdle because it carries the largest visible Call OI; 61,500 is the next supply area and 62,000 is the larger Call concentration. If Call OI at 61,000 starts unwinding while price holds above it, the path towards 61,500 improves. If fresh Calls build there and price rejects the level, I would expect the index to remain capped.
My Monday framework is straightforward: if Bank Nifty holds 60,500–60,000 and reclaims 61,000, I will watch whether it can sustain above 61,500 before challenging 62,000. That would confirm that the banking sector is still supporting the broader market after its stronger weekly performance. If it loses 60,500 and Put OI begins to unwind, I would look for a deeper retracement rather than assume the displayed monthly PCR will protect the index. The 23 November expiry is still some distance away, so price acceptance and fresh OI changes matter more than a single aggregate reading. In this environment, I also prefer hedged versus naked option strategies to keep your risk defined.
Sensex Option Chain Analysis
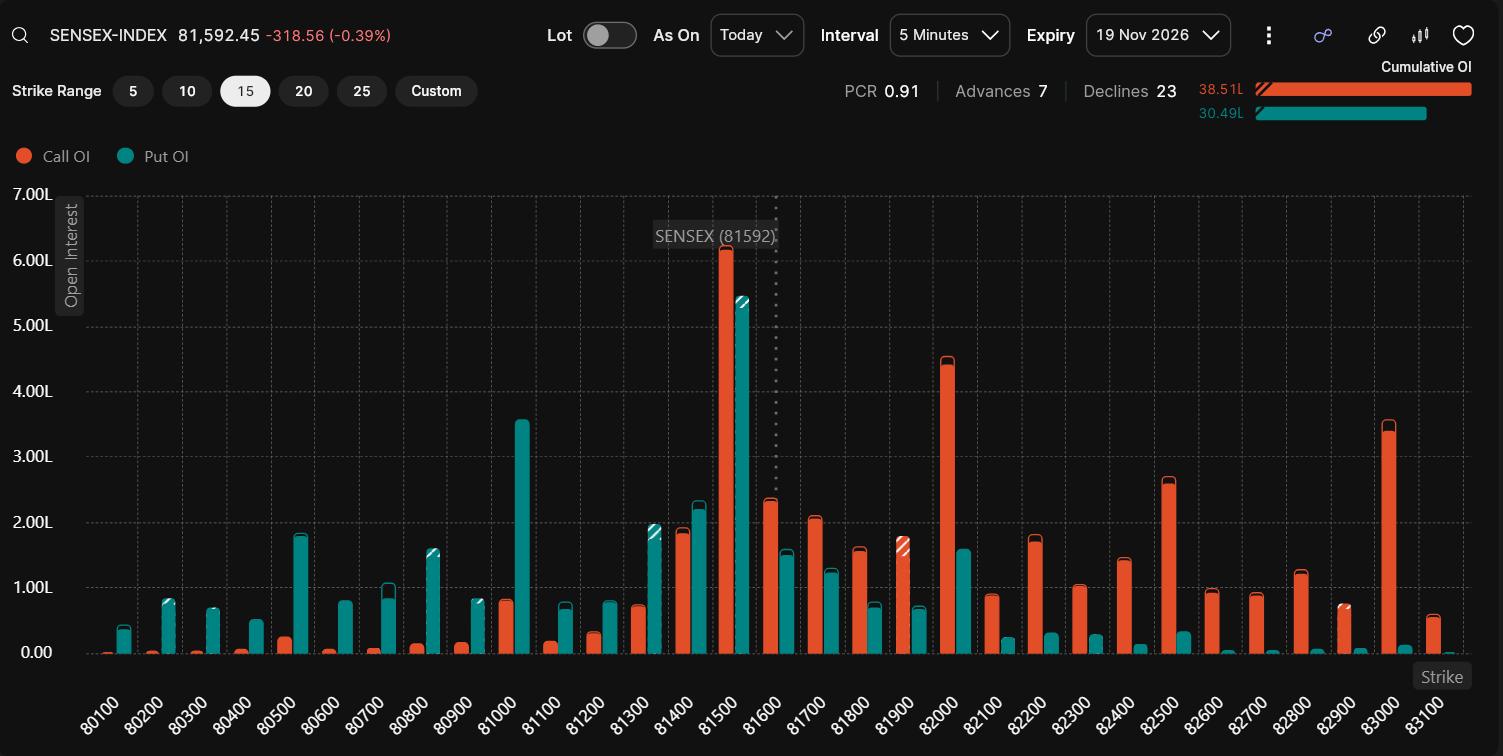
For Sensex, the Nuvama screenshot supplied for the 19 November 2026 weekly expiry shows spot at 81,592.45 and a displayed PCR of 0.91. The header shows cumulative Call OI of 38.51L and Put OI of 30.49L, with 7 advances against 23 declines. These counters are displayed separately from the PCR, so I report both as shown rather than using them to recalculate the platform ratio. The largest visible Call and Put concentrations are both at 81,500, making that strike the key positioning pivot rather than a one-way support level. On the Call side, 82,000 is the next notable concentration, followed by 82,500 and 83,000; on the Put side, 81,000 and 81,300 are the next visible bases. The screenshot does not display max pain, so I am not carrying forward the earlier public max-pain estimate.
The 81,500 strike matters because both sides are concentrated there. Sensex closed at 81,592.45, only slightly above that level, so I see it as the first decision zone: holding above it keeps the index balanced, while a sustained break below it opens 81,000 and then 80,500. The displayed PCR below 1 and the higher Call-OI counter both point to meaningful overhead supply, while the 7-versus-23 advance/decline reading shows weak breadth. I therefore want to see the index reclaim 82,000 with improving participation before treating the move as a fresh bullish leg.
On the downside, 81,500 is the first decision level, followed by 81,000 and 80,500. On the upside, 82,000 is the next visible Call-OI concentration, with 82,500 and 83,000 as higher supply references. The screenshot is the supplied November 13 broker view, and it does not show max pain. If Sensex holds 81,500 and Call OI at 82,000 begins to unwind, the recovery can extend; if it rejects 82,000 and then loses 81,500, I would favour consolidation rather than assume the Put concentration will automatically absorb selling.
For Monday, I will read Sensex together with Nifty and Bank Nifty. If all three hold their first support zones — 25,000 in Nifty, 60,500 in Bank Nifty and 81,500 in Sensex — and then reclaim their nearby Call-OI hurdles, the market has a better chance of extending the recovery. If Nifty loses 25,000, Bank Nifty breaks 60,500 and Sensex slips below 81,500, I would treat that as evidence that the market is digesting the recent advance. The screenshot's 81,500 two-sided concentration makes price behaviour around that strike especially important.
Nifty Prediction for Monday
Here is how I would frame Nifty for Monday: 25,000 is the first pivot because it is the largest visible Put-OI concentration in the 17 November chain. Below it, 24,800–24,700 is the next downside band. On the upside, 25,200 is the first hurdle, 25,300 is the next price confirmation and 25,500 carries the largest visible Call OI. The displayed PCR of 0.83 and weak 11-to-38 breadth reading tell me to demand confirmation rather than assume the weekly gain will automatically continue.
- In a bullish scenario, I want to see Nifty hold 25,000 and then sustain above 25,200–25,300. If Call OI around 25,200 begins to unwind and price can absorb supply towards 25,500, the next leg higher becomes more credible. I would only increase conviction after a successful retest; I would not chase a gap-up simply because the weekly close remains positive.
- In a bearish scenario, if Nifty loses 25,000 and then 24,800, I would watch 24,700 next. A sustained break below 24,700 accompanied by Put-OI unwinding would weaken the recovery structure and bring 24,500 into focus. The PCR below 1 does not create a bearish signal by itself, but it does mean I would be careful about assuming support without price confirmation.
Bank Nifty Prediction for Monday
Bank Nifty's Monday playbook begins with 60,500 on the downside and 61,000 on the recovery side. Friday's official close was 60,998, while the supplied Nuvama screenshot displayed 61,034.10. The screenshot shows 60,500 as the largest visible Put-OI concentration and 61,000 as the largest Call-OI concentration, with 62,000 as the next major Call cluster. I therefore want price to defend 60,500 and reclaim 61,000 before treating the weekly banking strength as ready for another leg.
If the index clears 61,000 and sustains above it, 61,500 becomes the next recovery hurdle; a clean move through 61,500 would bring 62,000 into focus. If it loses 60,500 and then 60,000, I would watch 59,500 and reassess the move. Bank Nifty remains one of my confirmation tools: if banks cannot hold the 60,500 Put-OI zone, I would be more cautious about chasing a Nifty breakout.
Sensex Prediction for Monday
For Sensex, the first question is whether the index can hold 81,500 after closing at 81,592.45. The supplied 19 November-expiry screenshot shows the largest visible Put and Call concentrations both at 81,500, with the next notable Call concentration at 82,000. That makes 81,500 a two-sided decision zone and 82,000 the first upside hurdle. If Sensex holds 81,500 and clears 82,000 with banking and broader-market participation, 82,500 becomes the next extension area. If 81,500 fails, I would watch 81,000 and then 80,500 rather than assume the Put concentration must hold.
Key Levels to Watch on Monday
What Traders Should Watch on Monday
Before placing your first trade on Monday, I would verify these four checkpoints:
- First, watch Monday's October WPI inflation release scheduled for 12:00 PM IST. October CPI has already risen to 6.09%, above the RBI's upper tolerance band, so wholesale-price data can influence expectations around margins, bond yields and future policy. I would not trade the release number in isolation; I want to see how bond yields, the rupee and rate-sensitive stocks respond.
- Second, map the price decision zones before the opening. For Nifty, that means 25,000 and then 24,800–24,700; for Bank Nifty, 60,500 and 60,000; for Sensex, 81,500 and 81,000. Nifty's weekly expiry is Tuesday, November 17, Sensex's weekly expiry is Thursday, November 19, and Bank Nifty's monthly expiry is November 23. I want to see whether these levels attract genuine demand or simply pause a pullback.
- Third, use the supplied Nuvama screenshots as the opening OI baseline and then track how the strikes change during Monday's session. Nifty's 17 November chain shows PCR 0.83, the largest visible Put concentration at 25,000 and the largest Call concentration at 25,500, with 25,200–25,400 as intermediate supply. Bank Nifty's 23 November chain shows 60,500 as the strongest Put concentration and 61,000 as the largest Call concentration, followed by 62,000. Sensex's 19 November chain has its largest visible Put and Call concentrations both at 81,500, with 82,000 the next Call hurdle. The screenshots do not show max pain, so I am not using a max-pain target. Fresh Put writing below spot and Call unwinding overhead would support continuation; Put unwinding or fresh Call writing near resistance would warn that supply is rebuilding.
- Fourth, watch whether FII buying continues and whether the market can absorb the inflation and oil risk. FIIs were net buyers for nine consecutive sessions in the latest published series through November 12, while DIIs were net sellers. Friday's FII/DII figures were not yet available at preparation. I will also track crude oil, the rupee near ₹94.24 per dollar, the rise in the 10-year government bond yield towards 7.31%, the IT sector's recent pullback and the ongoing earnings calendar. If breadth narrows sharply or banks lose their support zone, I would reduce position size even if the headline indices remain near their weekly highs.
Want to Trade with More Confidence?
Knowing market levels is useful. Building a repeatable process around risk, execution and market structure is what improves consistency.
Final Verdict
The market enters Monday after a positive week, but Friday's pullback deserves attention. Nifty gained about 0.46%, Sensex 0.70% and Bank Nifty 3.24% from November 6, even as all three indices declined on Friday. Foreign investors have been buying aggressively, and broader-market participation remained positive, but October CPI at 6.09%, higher food inflation, rising crude and a weaker rupee have made the macro backdrop more challenging. For me, this is a recovery that still has support — but it needs to prove that it can absorb fresh supply.
For Monday, I am using 25,000 as Nifty's first pivot, with 24,800–24,700 as the initial support band and 25,200–25,500 as the first recovery test. Bank Nifty needs to defend 60,500–60,000 and reclaim 61,000 before 61,500–62,000 can come into play, while Sensex should hold its 81,500 two-sided OI pivot and work through 82,000. The three Nuvama screenshots are now incorporated; they show Call-heavy positioning in Nifty and Sensex, while Bank Nifty's displayed PCR and cumulative counters should be read separately. I will only increase conviction if price holds these pivots, fresh OI supports the move and the WPI release does not trigger another rise in yields or pressure on the rupee.
Remember, our job is not to predict the market blindly, but to react systematically when price interacts with predefined levels. Strong foreign buying and a positive weekly close are constructive, but Friday's decline, higher inflation and renewed oil pressure are reminders that momentum can change quickly. Protect capital, avoid chasing extended candles, and let price, breadth and current OI confirm whether buyers are ready to take control again.
Disclaimer: This article is intended solely for educational and informational purposes. The views are based on market structure and publicly available information and should not be construed as investment or trading advice. Trading and investing involve risk; define risk before taking any position.
Replete Equities
This is today's read. Want to know what's actually limiting your own trading?
Get your free Trading Maturity Score in 5 minutes — no card required.