OI vs Price Action: Why Open Interest Predicts Better for New Traders
Open interest is a more reliable indicator of market sentiment than price action. Learn why open interest is more important for traders and how to use it to your advantage.
Hey new traders! Starting out in the markets can feel overwhelming—like you're chasing shadows on a chart. You've probably heard about price action, spotting those candlestick patterns and trends. But what if there's a better tool to predict what's next? Enter Open Interest (OI), the beginner-friendly secret that shows you what big traders are really doing behind the scenes.
In this guide, we'll break it down step by step, no jargon overload. If you're just dipping your toes into options or futures trading, OI will help you make smarter decisions without guessing games. Let's see why OI is like your market map, especially compared to price action.
What is Open Interest? The Basics Explained
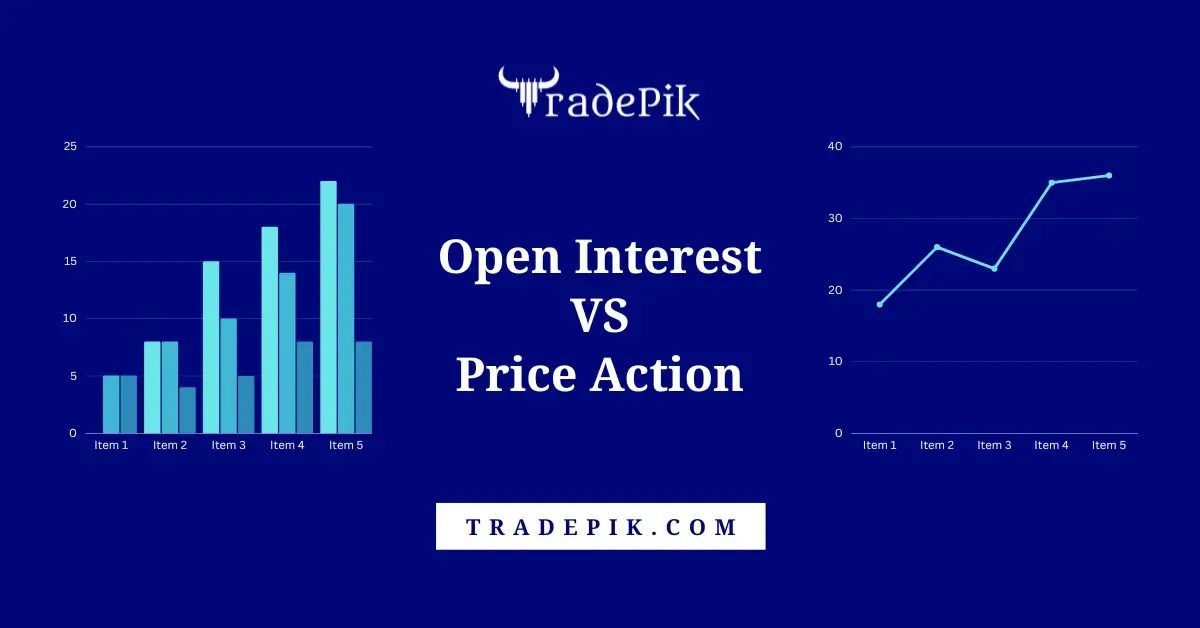
Imagine you're at a busy marketplace. Price action is like watching people rush around—exciting, but it only shows the current chaos. Open Interest? It's the count of ongoing deals that haven't finished yet.
Simply put, Open Interest is the total number of futures or options contracts that are still open at the end of a trading day. These are active bets between buyers and sellers. When a new buyer and seller create a fresh contract, OI goes up by one. If they close it (by buying back or selling out), OI drops.
For beginners, think of it like this: OI tracks "commitment." High OI means lots of traders are serious about holding positions. Low OI? The market might be thinning out, leading to wild swings. Unlike volume (which counts all trades in a day), OI focuses on what's left open, giving a clearer picture of ongoing interest.
Quick Example for Clarity: Suppose Trader A buys 10 call options from Trader B on a stock like Reliance. That's a new contract—OI rises to 10. Next day, Trader C sells 5 to Trader D—OI now at 15. But if A sells back to D (closing the deal), OI falls to 10. Old deals swapping hands don't change OI; only fresh or closed ones do.
This is key for you as a newbie: OI helps spot if money is flowing in (rising OI) or out (falling OI), hinting at market strength.
Why Price Action Alone Isn't Enough for Beginners
Price action is great—it's the ups and downs you see on charts, like support levels or breakouts. But for beginners, it can be misleading. A price spike might look bullish, but is it real or just a quick fakeout from news hype?
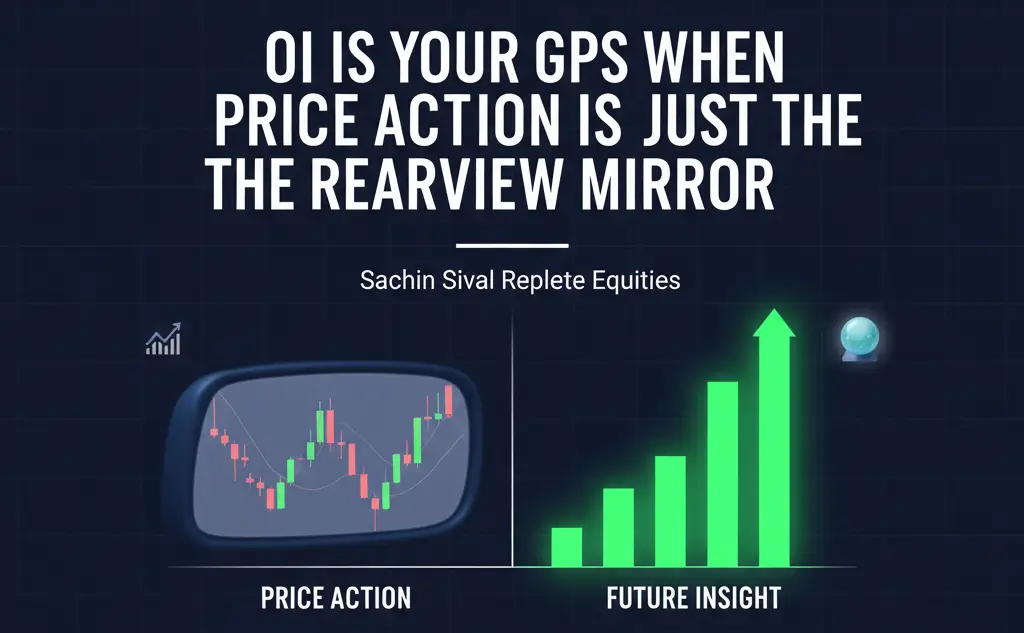
Price tells you where the market has been, based on past trades. It's reactive, like checking your speedometer after the race. Beginners often chase these moves and get burned by reversals. In options trading, where timing is everything, relying only on price can lead to FOMO (fear of missing out) trades.
The issue? Prices can be tricked by rumors or big orders. As a starter, you need something more reliable to build confidence. That's where OI shines—it reveals the "why" behind the price.
Reason 1: OI Acts Like Your Market Crystal Ball
For beginners, predicting trends feels impossible. Price action shows history, but OI hints at the future by tracking new money entering the market.
When prices rise and OI increases, it's a strong bullish sign—new buyers are jumping in, fueling the uptrend. Falling prices with rising OI? Smart money might be building shorts for a drop. This combo helps you confirm if a move has legs.
Beginner Example: You're eyeing a stock dropping for days. The chart screams "sell," but OI is climbing. This could mean big players are quietly buying at lows, setting up a bounce. Instead of panic-selling, you might wait or even buy calls.
Real-world tip: In options, watch call OI buildup at strike prices near current levels—it often signals resistance.
Practice this: On your trading app (like Zerodha or Groww), check daily OI changes alongside price. Over time, you'll spot patterns without advanced tools.
Reason 2: OI Cuts Through Price Tricks and Noise
Markets love to fool beginners with sudden jumps or dips. A hot news headline spikes the price—yay, right? Not always. OI shows if traders are truly committed or just reacting emotionally.
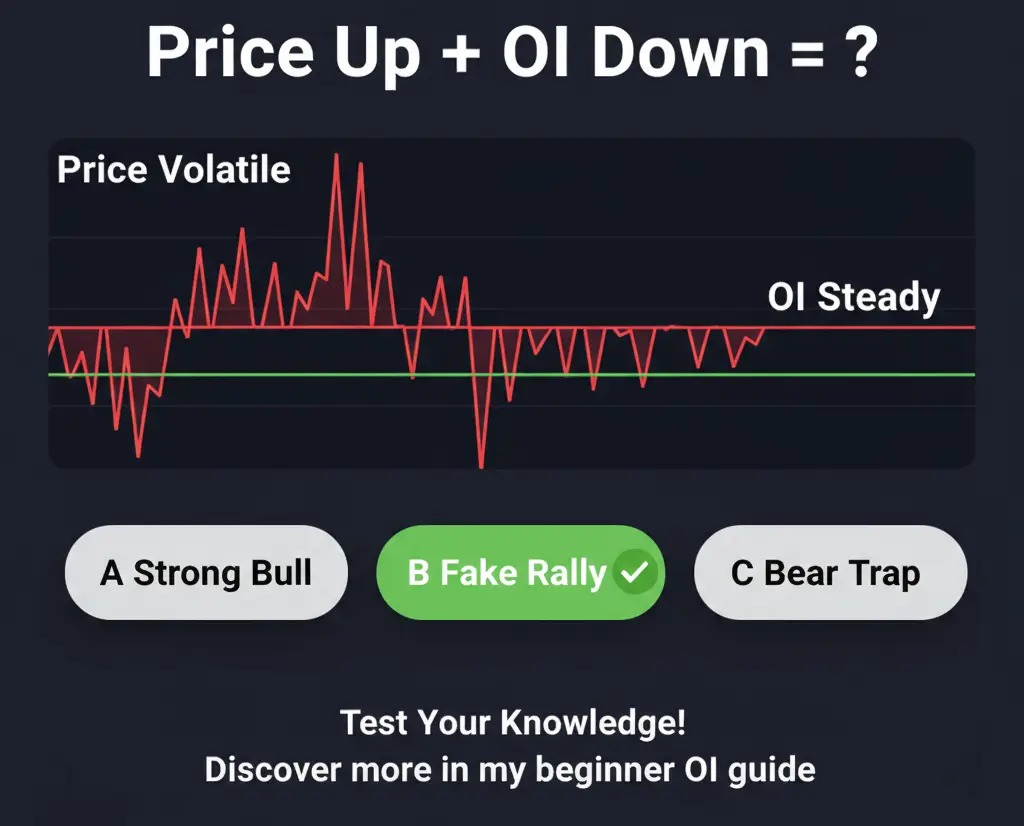
If price gaps up but OI drops (long unwinding), it's likely a fake rally—sellers are cashing out, so expect a pullback. High OI with steady price? That's real strength, as positions are building.
Simple Breakdown for Newbies:
- Price Up, OI Up: Bulls in control—new longs opening. Good for buying dips.
- Price Up, OI Down: Weak rally—closing shorts or profit-taking. Stay cautious.
- Price Down, OI Up: Bears building—new shorts. Avoid buying.
- Price Down, OI Down: Trend weakening—possible reversal.
As a beginner, use OI to avoid "trap" trades. Pair it with basic volume: High volume + rising OI confirms the price move. This duo is like training wheels for options analysis.
Reason 3: OI Reveals Hidden Support and Resistance Levels
Beginners draw lines on charts for support (floor) and resistance (ceiling), but why do they work? Psychology! OI uncovers where crowds cluster their bets.
High OI at a strike price acts like a magnet. Lots of open calls there? Buyers defend it as resistance. Piles of puts? Sellers push back at support. It's the "battle lines" of big money.
Easy Example: In options chains, spot max OI for a stock's puts at ₹500. If price nears ₹500 and OI holds steady, expect buyers to step in. For calls at ₹550 with high OI, that's a resistance wall—price might stall.
For you starting out, focus on one index or stock daily. Use free tools like NSE India to view OI data. Combine with simple price charts—no need for fancy indicators yet.
How Beginners Can Use OI Like a Pro (Step-by-Step)
Ready to try? Start small to build skills without risk.
- Track Daily Changes: Pick one asset, note price move and OI shift each day. Apps show this in option chains.
- Combine with Basics: Mix OI with price and volume. Rising OI + up price + high volume = strong buy signal.
- Watch for Flips: If OI falls during a price rally, the trend might fade—time to exit.
- Avoid Overload: As a newbie, ignore complex Greeks; focus on OI trends for sentiment.
Pro Tip: Practice on paper trades. Simulate: "Price up 2%, OI up 5%—bullish!" This builds intuition fast.
Common Beginner Questions on OI and Price Action
What if OI and price disagree?
Follow OI—it's often the leader. Price lags behind real money flows.
How do I access OI data?
Free on NSE/BSE sites, or trading platforms like Angel One. Look under "Option Chain".
Is OI only for options?
No, it works for futures too, but shines in options for beginners spotting strikes.
Can OI predict exact prices?
Not precisely, but it flags trends early. Use with stop-losses always.
Ready to Level Up Your Trading?
OI isn't magic, but for beginners, it's the edge over pure price chasing. Track it daily, and you'll trade calmer, spotting opportunities others miss. With 13+ years in derivatives, I've seen newbies transform using OI in my Option Strategies Mentorship Program—live sessions on basics like OI, PCR, and simple hedges, tailored for starters.
Final Thought: Ditch the guesswork. Let Open Interest guide your first steps to confident trades. Questions? Drop them below—we'll decode together! 🚀
Happy trading,
Sachin Sival
P.S. Share with a friend just starting out—they'll thank you for the OI tip! 👇💬

Comments ()