Stock Market Prediction for Monday (Mar 30, 2026) | Nifty, Bank Nifty Levels & Market Insights
Get Nifty, Bank Nifty, and sector levels for Monday, Mar 30, 2026. Read expert market predictions, support/resistance & trading tips for the week ahead.

Hello friends,
We’ve just closed out a rough week for the Indian stock market, with both Nifty and Bank Nifty coming under strong selling pressure on Friday and breaking below key short‑term supports. Global risk‑off cues, persistent FII selling and profit‑booking in financials dragged the indices lower, even as domestic flows tried to cushion the fall.
In this article, let’s walk through how this week played out, look at Nifty and Bank Nifty levels, read the option‑chain cues, and then build an educational, probability‑based stock market prediction for Monday in a simple, structured way.
Weekly Stock Market Review
Indian Stock Market Today – How This Week Played Out
Nifty 50:
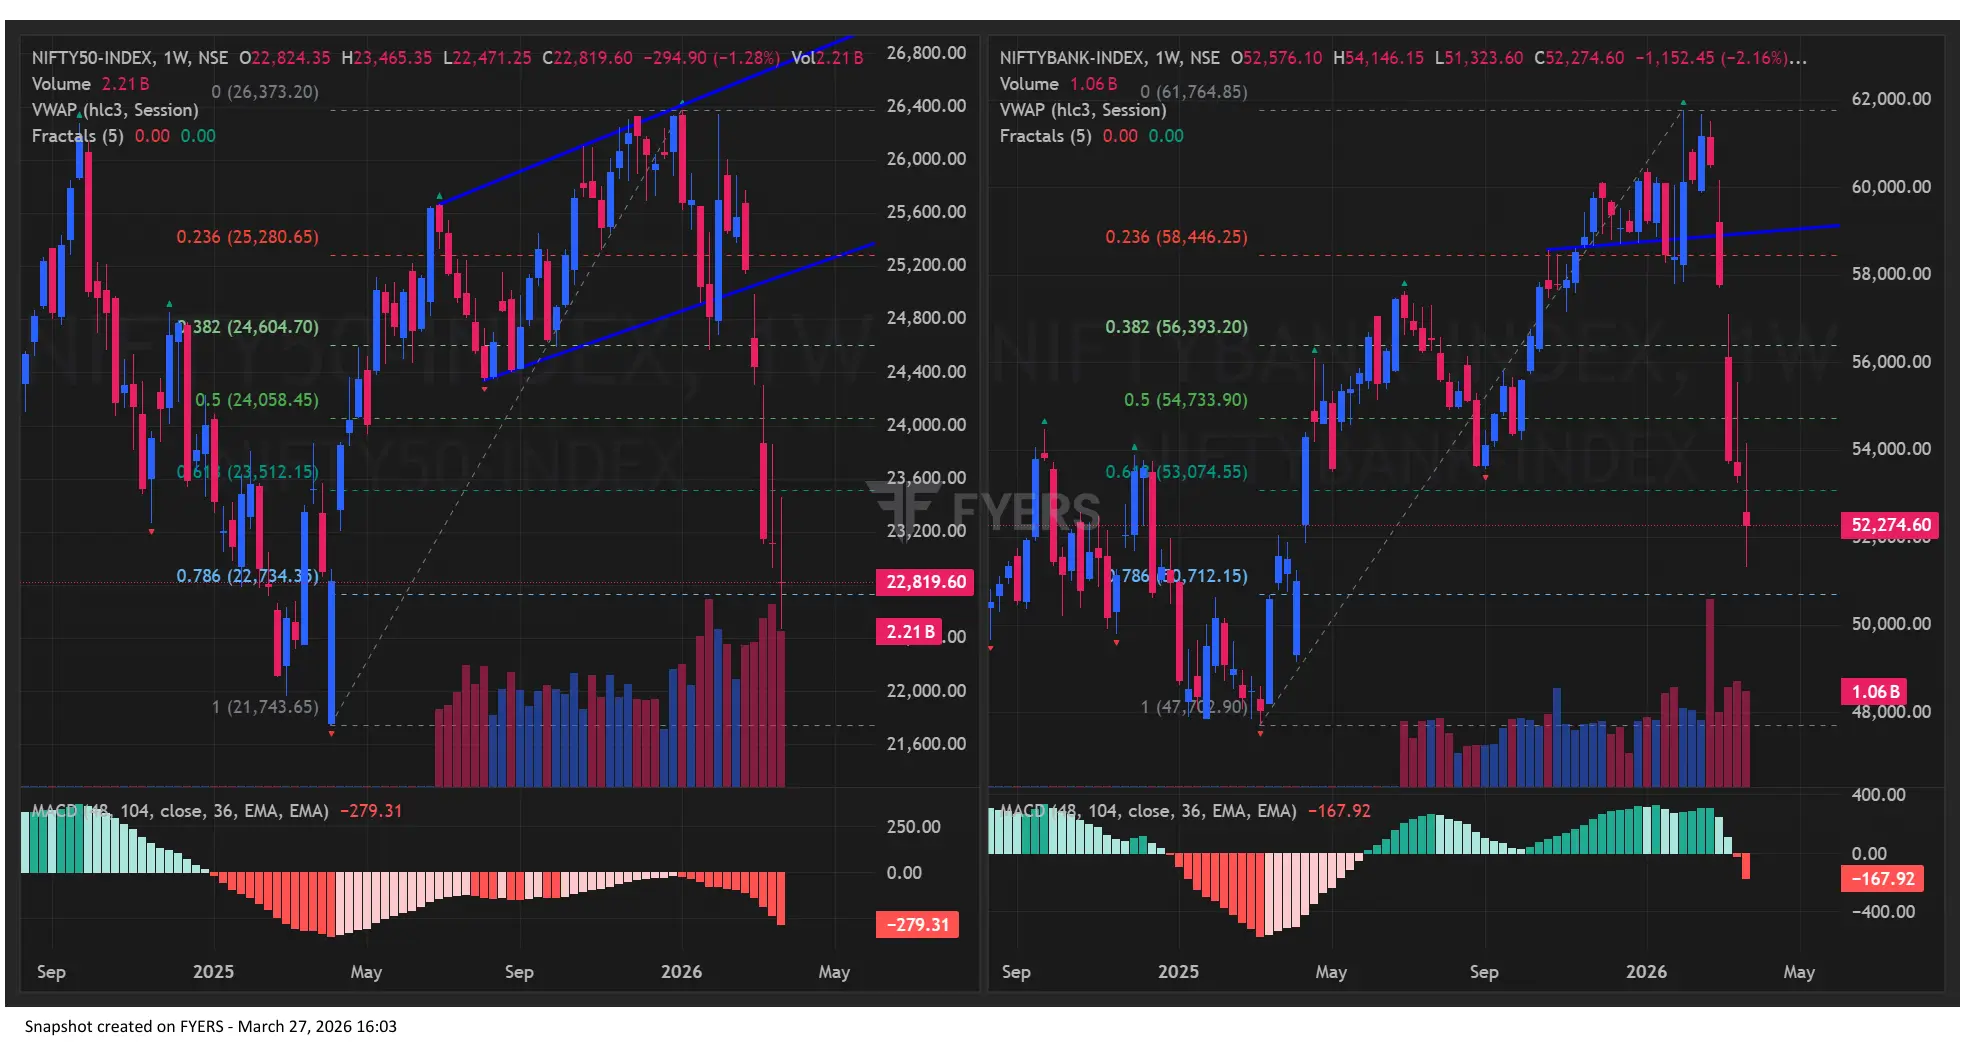
Nifty has spent most of March in a consolidation band and has now decisively broken below the 23,000–23,200 zone following a sharp decline on Friday. Multiple down days over the last few weeks have turned the post-Budget 2026 rally into a choppy corrective phase, with the index repeatedly failing to hold above short-term resistance. The final snapshot shows Nifty 50 closed at 22,819.60, down 486.85 points (2.09%), highlighting the intensity of the Friday sell-off and the loss of the key 23,000 psychological handle.
Nifty 50: BankNifty (Nifty Bank):
Bank Nifty faced even steeper pressure. While derivatives screens earlier in the year showed it comfortably above 60,000, recent volatility has pulled the index back toward the 52,500 level. On March 27, Bank Nifty closed at 52,274, falling 1433 points (2.67%). After opening at 53,244.25 and failing to sustain an early high of 53,259.75, the index saw aggressive intraday selling. While it remains above its 52-week low of 49,156.95, the short-term trajectory has shifted firmly downward.
Broader Market:
Market breadth worsened as the week progressed. This week’s move cemented the shift into a corrective phase rather than a trending one. Mid-cap and small-cap segments typically underperform during such periods of high volatility, and the current pattern is no different. The India VIX (Volatility Index) spiked over 12% today, reflecting increased trader anxiety.
What Drove Markets This Week
- Global Risk-Off: GIFT Nifty futures and global indices pointed to a weak backdrop throughout the week. The latest snapshot showed GIFT Nifty around 22,956.50, down 0.49% intraday on March 27.
- Institutional Flows: FIIs (Foreign Institutional Investors) remained net sellers, offloading over ₹4,200 crore in the cash market today. While DIIs (Domestic Institutional Investors) continued to buy, it wasn't enough to reverse the heavy selling pressure.
- Macro Headwinds: Financials were at the center of the weakness, but the surge in Brent Crude to $108/barrel and the Rupee hitting a record low of 94.75 against the Dollar were the primary catalysts for the broader market exit.
Key Technical Levels & Market Bias for the Week Ahead
Let’s mark the key reference zones for Monday based on this week’s highs, lows and closing levels.
Key Index Levels
| Index | Support Levels | Resistance Levels | Short-Term Bias |
|---|---|---|---|
| Nifty 50 | 1st: 22,700 / 22,500 | 1st: 23,200 / 23,400 | Mildly bearish / range |
| Bank Nifty | 1st: 52,000 / 51,500 | 1st: 53,000 / 53,700 | Weak, corrective |
Nifty Outlook – Key Zones
Nifty’s recent range has been under heavy pressure, with the index breaking below the crucial psychological level of 23,000 during Friday's trade. It settled at 22,813.80, losing over 2% on a weekly basis.
- Immediate Support: 22,650–22,700. This zone acted as a floor during today's panic flush. A break below this level could lead the index toward the 22,450 mark (the March 23 low).
- Stronger Support: 22,100–22,300. This remains the logical demand zone if global selling persists and crude prices remain elevated.
- Immediate Resistance: 23,000–23,150. The 23,000 mark has now transitioned from support to a stiff resistance zone.
- Higher Resistance: 23,400–23,500. This area saw significant profit booking earlier in the week and will likely act as a supply cap for any relief rallies.
Summary: Nifty is currently in a confirmed short-term downtrend. Until it decisively reclaims and sustains above the 23,200 level, the index remains vulnerable to further corrections.
Bank Nifty Prediction – Key Zones
Bank Nifty mirrored the broader market's weakness, closing at 52,519.65 (down 2.21%). High-weightage private banks faced heavy institutional selling, dragging the index near its weekly lows.
- Immediate Support: 52,000–52,200. This remains the primary defense line for the bulls.
- Deeper Support: 51,300–51,500. A breach of the 52,000 mark will likely open the doors for a slide toward this stronger support base.
- Immediate Resistance: 53,000–53,250. Friday's opening high near 53,260 now acts as a primary hurdle.
- Higher Resistance: 53,800–54,150. This is the zone from which the index reversed sharply this week; expect heavy selling pressure here.
Summary: While Bank Nifty’s 52-week range remains wide (49,156 to 61,764), the current structure is fragile. The index needs to hold the 52,000 psychological support to prevent a deeper slide toward the 50,000 levels.
Sector & Stock Performance Snapshot
Stronger Pockets
In a week dominated by selling, relative strength rather than absolute gains is what stands out:
- Select defensives: Some FMCG and healthcare names showed relatively smaller drawdowns compared with financials and cyclicals, as investors looked for stability.
- Domestic stories: Certain domestic demand‑linked sectors, such as staples and utilities, tend to hold up better during macro uncertainty; recent commentary around DII buying and domestic resilience supports this narrative.
Softer Pockets
- Banks & financials: The 2.21% fall in Bank Nifty on March 27 highlights broad‑based weakness in banking names, including both PSU and private players.
- High‑beta segments: Midcaps, smallcaps and momentum names typically suffer more when Nifty corrects from the top of its range, and the recent four‑week performance pattern points to that kind of behaviour.
This week was less about sector rotation in favour of new leaders and more about across‑the‑board risk reduction.
Institutional Activity Overview
FII & DII Flows – March 23–27, 2026
Recent institutional data from NSE and related analyses highlight a familiar but intense pattern.
- On 23 March 2026, DIIs were strong net buyers, with inflows of about ₹12,033.97 crore, while FIIs were aggressive net sellers, pulling out about ₹10,414.23 crore.
- On 25 March 2026, DIIs again bought heavily (net +₹5,173.01 crore), while FIIs sold about ₹1,508.89 crore in the cash segment.
- By 27 March 2026, provisional FII/DII data show FIIs’ cash‑market net figure for March firmly negative (‑₹1,805.37 crore), while DIIs’ net figure is strongly positive (+₹5,429.78 crore), with additional long exposure by FIIs in index futures and options.
In simple words: domestic institutions are supporting the market, but they are having to absorb a lot of foreign selling. That’s why we are seeing corrections, not crashes — at least so far.
Volatility & Context
The derivatives summary shows FIIs are net buyers in index futures and options (FII Index Fut +₹1,601.50 crore, FII Index Opt +₹2,945.83 crore), even as they sell in cash. This mix often indicates hedging and short‑term trading rather than pure directional conviction. Volatility has picked up from the very low levels of earlier months, increasing option premiums and making risk‑defined strategies more attractive for many traders.
Option Chain Analysis & Market Sentiment
Option‑chain data gives us a live map of where big money is placing support and resistance.
Nifty 50 Option Chain (near‑term view)
Based on the Open Interest (OI) chart for Friday, March 27, here is the updated analysis. The data shows a significant shift in market sentiment, with call writers aggressively moving lower to cap any potential recovery.
NSE Derivatives Analysis: Nifty OI & Sentiment
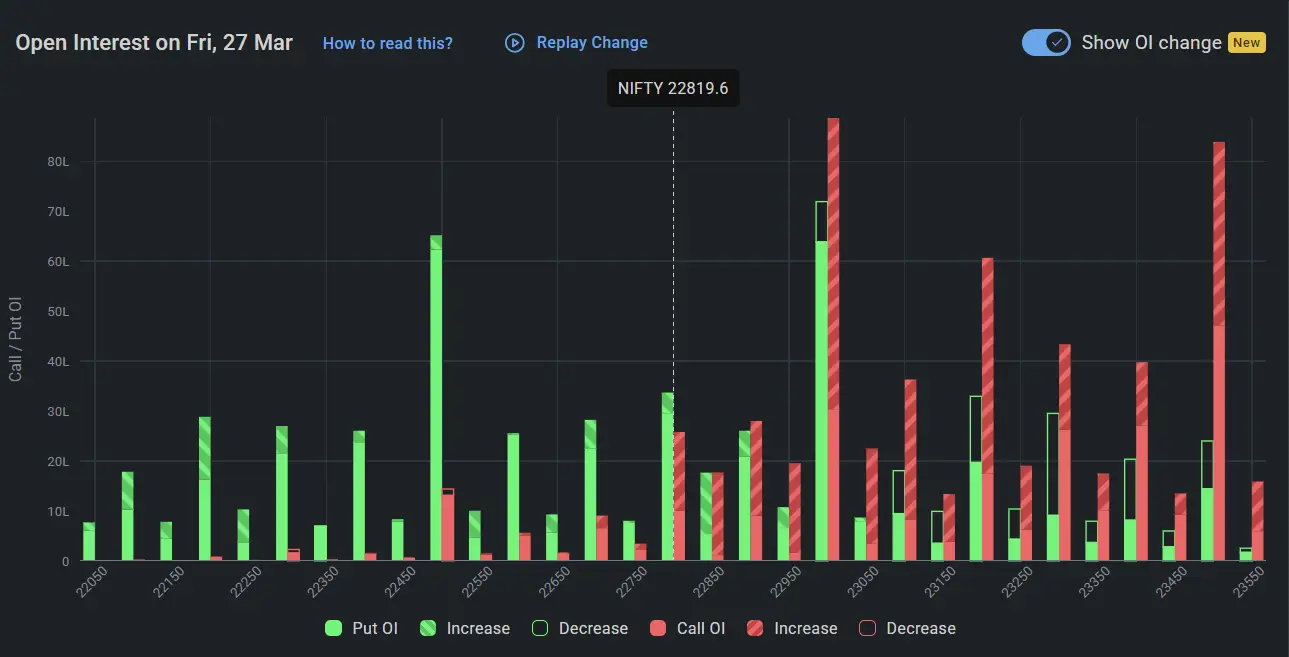
The latest OI distribution for Nifty shows a defensive posture from bulls and a dominant "sell-on-rise" strategy from bears. Based on the current snapshot with Nifty at 22,819.60:
- Put OI Clusters (Support): The most significant defensive wall is at 22,500, where we see a massive spike in Put Open Interest (green bars). There is also notable support at 22,700 and 22,800, but these levels look fragile compared to the heavy call build-up above.
- Call OI Clusters (Resistance): Resistance has moved much closer to the spot price. Huge Call OI (red bars) is visible at 23,000, which will act as a major psychological and technical hurdle. Further heavy call writing is stacked at 23,200 and 23,500, suggesting traders are heavily shorting any upside.
- PCR (Put-Call Ratio): The ratio is tilting toward bearish territory. The chart shows Call OI significantly outstripping Put OI at almost every strike above 22,850, indicating a lack of confidence in a quick recovery.
- Max Pain: With the massive concentration of OIs at 23,000 and the deep support at 22,500, the current Max Pain (the strike where option buyers lose the most) is trending lower toward the 22,900–23,000 zone, significantly lower than earlier in the week.
Sentiment Takeaway for Nifty
The option chain paints a bearish and heavy picture. While the 22,500 strike offers a strong structural floor, the immediate upside is severely restricted. The aggressive increase in Call OI at 23,000 suggests that the market does not expect Nifty to reclaim this level easily in the next few sessions.
Bank Nifty Option Chain (near‑term view)
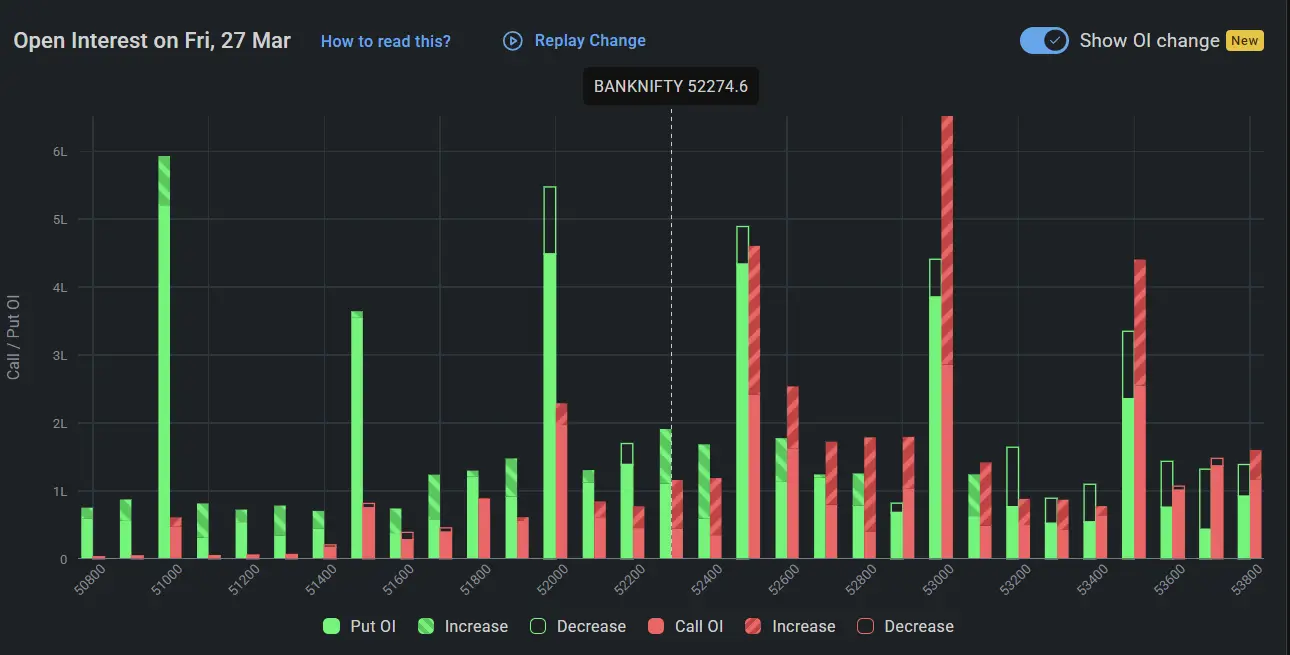
With Bank Nifty closing at 52,274.60 (as per the chart snapshot), the options layout shows significant congestion and a growing wall of resistance:
- Put Side (Support): The most critical support is now at 51,000, where there is a massive Put OI spike. More immediate support is visible at 52,000, which saw a heavy build-up of put writing today, and 51,500. These levels represent the "floor" bulls are trying to defend.
- Call Side (Resistance): The strongest resistance has formed at 53,000, which shows the highest Call OI concentration on the chart. Significant call writing is also visible at 52,500, suggesting that traders are already "selling the bounce" very close to the current market price.
- PCR & Max Pain: The Put-Call Ratio (PCR) is increasingly bearish. Max Pain has shifted lower toward the 52,500–52,600 zone, reflecting the index's sharp descent and the market's expectation that any recovery will face immediate supply.
Sentiment takeaway for Bank Nifty:
The index is in a fragile corrective state. While the 52,000 and 51,000 strikes provide a safety net, the heavy call writing at 53,000 acts as a "hard ceiling." The trend suggests that unless the index can break and sustain above 52,500, the bias remains skewed toward the downside or a narrow, volatile range.
Important News, Events & Catalysts
Domestic Drivers
- Macro Headwinds: The market is navigating a "triple threat": the Rupee hitting a record low of 94.75, Brent Crude spiking to $108, and the aftermath of a 1.5% spike in domestic inflation data released earlier this week.
- Fiscal Year-End Positioning: As we approach the final sessions of FY25-26, institutional window dressing and tax-loss harvesting are contributing to the current volatility.
- The DII Shield: Despite FIIs pulling out over ₹4,200 crore on Friday, domestic liquidity remains the primary floor, with SIP inflows hitting new record highs this month.
Global Drivers
- Geopolitical Escalation: Rising tensions in the Middle East over the weekend remain the "X-factor." Any further escalation will likely keep the "Risk-Off" sentiment active for Monday’s open.
- GIFT Nifty Signal: With GIFT Nifty trading at 22,956 (below the 23,000 mark), a gap-down or a muted start is the most probable scenario for Monday morning.
Stock Market Prediction for Monday – Educational View
Nifty Outlook for Monday
- The 23,000 Battleground: If Nifty fails to reclaim 23,000 in the first hour, the bias remains firmly bearish. A sustained move above 23,000 could lead to a technical pullback toward 23,150–23,200, where heavy Call OI is stacked.
- Downside Risk: A break below Friday's low of 22,750 opens the doors for a quick slide toward 22,500, which is the "ultimate" support according to the current Put OI cluster.
- Pattern: Expect a "sell on rise" environment. Unless global cues turn overnight, rallies toward 23,100 will likely face fresh short-selling.
Bank Nifty Prediction for Monday
- Crucial Support: The 52,000–52,200 zone is the line in the sand. If the index holds this, a move toward 52,800–53,000 is possible.
- The 53,000 Ceiling: Based on the massive Call OI at 53,000, this level will act as a major supply zone. Any recovery toward this mark is likely to see profit booking.
- Relative Strength: Bank Nifty has shown slightly higher volatility than Nifty; a break below 52,000 could trigger a swift 500-point drop toward the 51,500 support pocket.
Strategy Thinking (Educational Only)
- Zone-Based Trading: Treat 22,800 (Nifty) and 52,200 (Bank Nifty) as pivotal zones. Price action around these levels in the first 30 minutes will dictate the trend for the day.
- Hedged Approaches: Given the high India VIX (spiking 12%), naked option buying is risky due to high premiums and potential "theta decay" if the market consolidates. Hedged strategies like Bear Put Spreads or Iron Condors are often preferred by seasoned traders in this environment.
- Crude Oil Watch: Keep a close eye on Brent Crude prices during Monday's session; any move toward $110 will likely trigger further selling in auto and paint stocks.
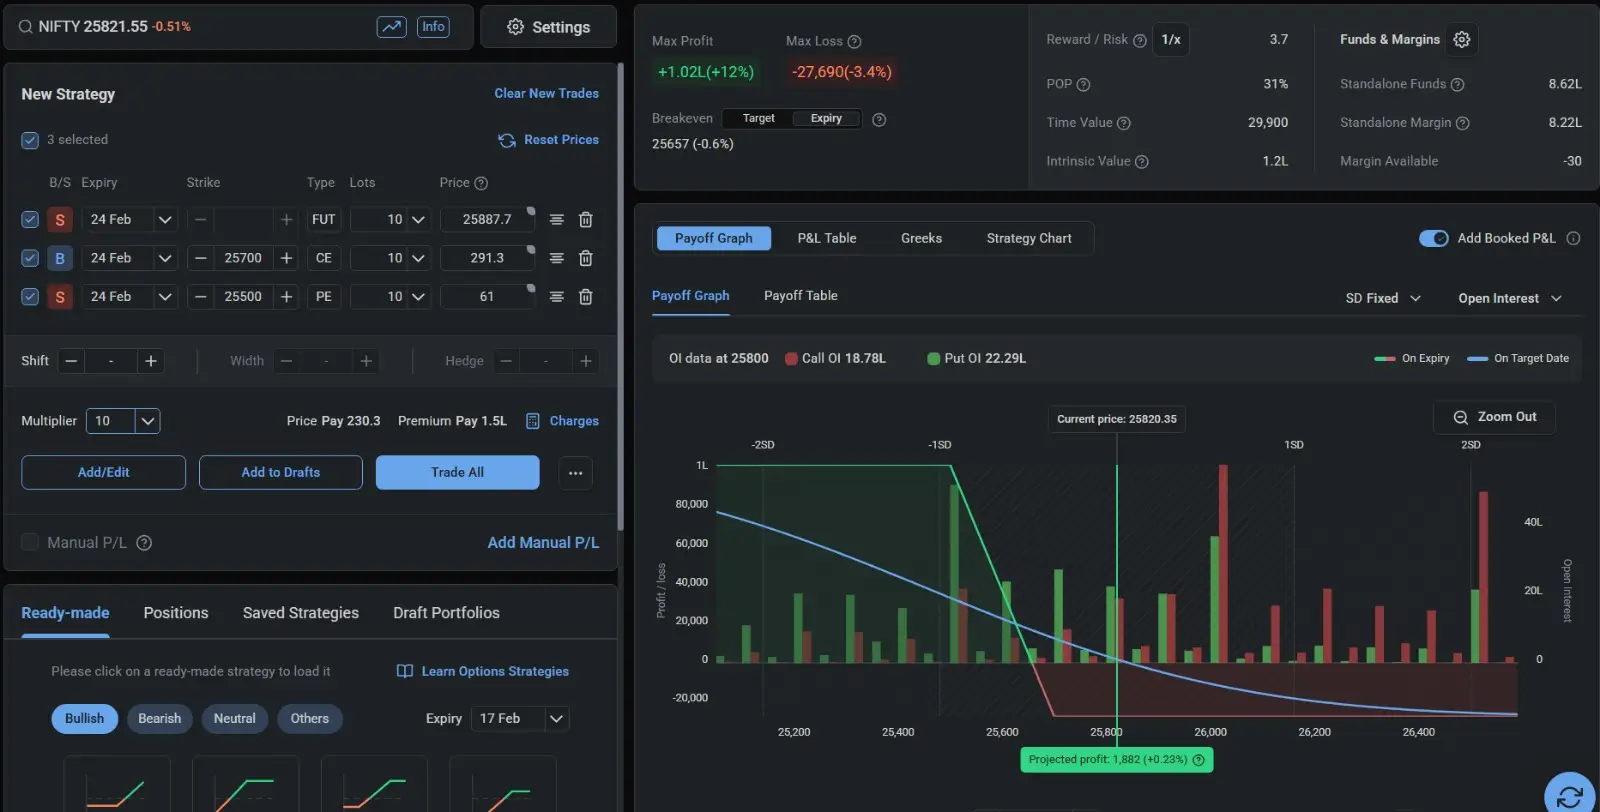
We have created and shared the above strategy in our WhatsApp Community. Click on the button below to join and get these strategies!
Final Market View & Bias for Monday, March 30, 2026
Nifty 50 Bias: Bearish to Range-bound.
After breaking the 23,000 psychological floor on Friday, the outlook remains heavy.
- Key Support: 22,500–22,700 is the critical demand zone based on the massive Put OI at 22,500.
- Resistance Band: 23,000–23,200. Sustained trade above 23,200 is required to signal a trend reversal; otherwise, every bounce toward 23,000 is likely to be met with aggressive call writing.
Bank Nifty Bias: Weak but approaching a "Make-or-Break" zone.
- Key Support: 52,000–51,000. While 52,000 is the immediate psychological floor, the structural support according to OI clusters sits deeper at 51,000.
- Resistance Band: 53,000–53,500. The heavy concentration of call sellers at 53,000 makes it a formidable "hard ceiling" for Monday.
Sentiment & Strategy Market Mood: Caution prevails. With FIIs in aggressive selling mode (offloading over ₹4,200 crore on Friday) and global headwinds like Brent Crude at $108 and the Rupee at 94.75, the environment favors capital preservation.
- The "X-Factor": Any weekend escalation in the Middle East could trigger a gap-down.
- The Disciplined Approach: This is a market for hedged strategies and defined-risk spreads rather than naked overnight positions.
The Monday Trigger: Watch the first 30 minutes of trade. If Nifty stays below 22,850 and Bank Nifty breaks 52,000, expect another leg of long unwinding. Conversely, holding these levels could trigger a late-afternoon short-covering bounce toward the Max Pain zones (23,000 for Nifty and 52,600 for Bank Nifty).
Stay connected with Replete Equities for informed, structured market insights — and remember, consistency is a skill built over time.
Disclaimer
This article is for educational and informational purposes only. It is not investment or trading advice, and it does not recommend buying or selling any security or derivative. The stock market involves significant risk, including the risk of loss of capital. All levels and views mentioned here are based on publicly available data and may change without notice. Past performance is not indicative of future results. Please consult a SEBI‑registered financial advisor before making any investment or trading decisions, and always ensure that your actions align with your personal risk profile and financial goals.


Comments ()