Stock Market Prediction for Tomorrow (26 May 2025): Nifty & Bank Nifty Outlook, Key Levels, FII-DII Flow, and Correction Analysis
Stock Market Prediction for Tomorrow (26 May 2025) | Nifty & Bank Nifty Key Levels. Read the latest stock market prediction for 26 May 2025 with Nifty and Bank Nifty support & resistance levels, FII-DII activity, and NASDAQ 100 correction analysis.

Happy Friday, market enthusiasts! 📅
Let’s gear up for another session with your daily dose of insights. Today’s post gives you the stock market prediction for tomorrow (26 May 2025), focusing on critical Nifty and Bank Nifty levels, derivatives cues, and a fascinating historical study of the NASDAQ 100 correction analysis.
📊 Nifty Levels for Tomorrow: Holding the Fort?
After Nifty ended with 200 pt cut even after a sharp recovery in the last hour of Thursday's trade due to its weekly expiry panning out, on Firday we saw some recovery and Nifty manage to close above 24800.
The bullish outlook toward 25,400 remains intact as long as Nifty holds above the crucial 24,800 support zone. A close below this level could change the short-term trend.
📌 Nifty Levels for Tomorrow:
- Support: 24,600
- Resistance: 25,400
Pro Tip 💡: Until Nifty gives a closing below 24,800, it’s premature to turn bearish. Think of 24,800 as the “line in the sand” for bulls.
🏦 Bank Nifty Levels: The Calm Before the Breakout?
Bank Nifty closed positive on Friday, continuing to respect its long-term trendline support. The structure is still coiling for a move, and a breakout above 55,600 could unleash fresh bullish momentum.
On the flip side, solid support is visible only below 54,400, so this range becomes critical for short-term traders.
📌 Bank Nifty Levels for Today:
- Support: 54,400
- Resistance: 55,600
This narrow range might soon give way to volatility—stay nimble and alert!
🚀 NASDAQ 100’s Fastest-Ever Comeback — What This Chart Is Screaming at Smart Investors
In what might be one of the most underappreciated bullish signals of the year, the NASDAQ 100 has pulled off something no one saw coming — and the chart below tells the story better than words ever could.
📉 After a 25.26% correction, bottoming in April 2025, the index bounced back with lightning speed. By May 20, 2025, it had recovered to just 3% below its all-time high — and it did so in just 30 days. That’s not just fast. It’s unprecedented.
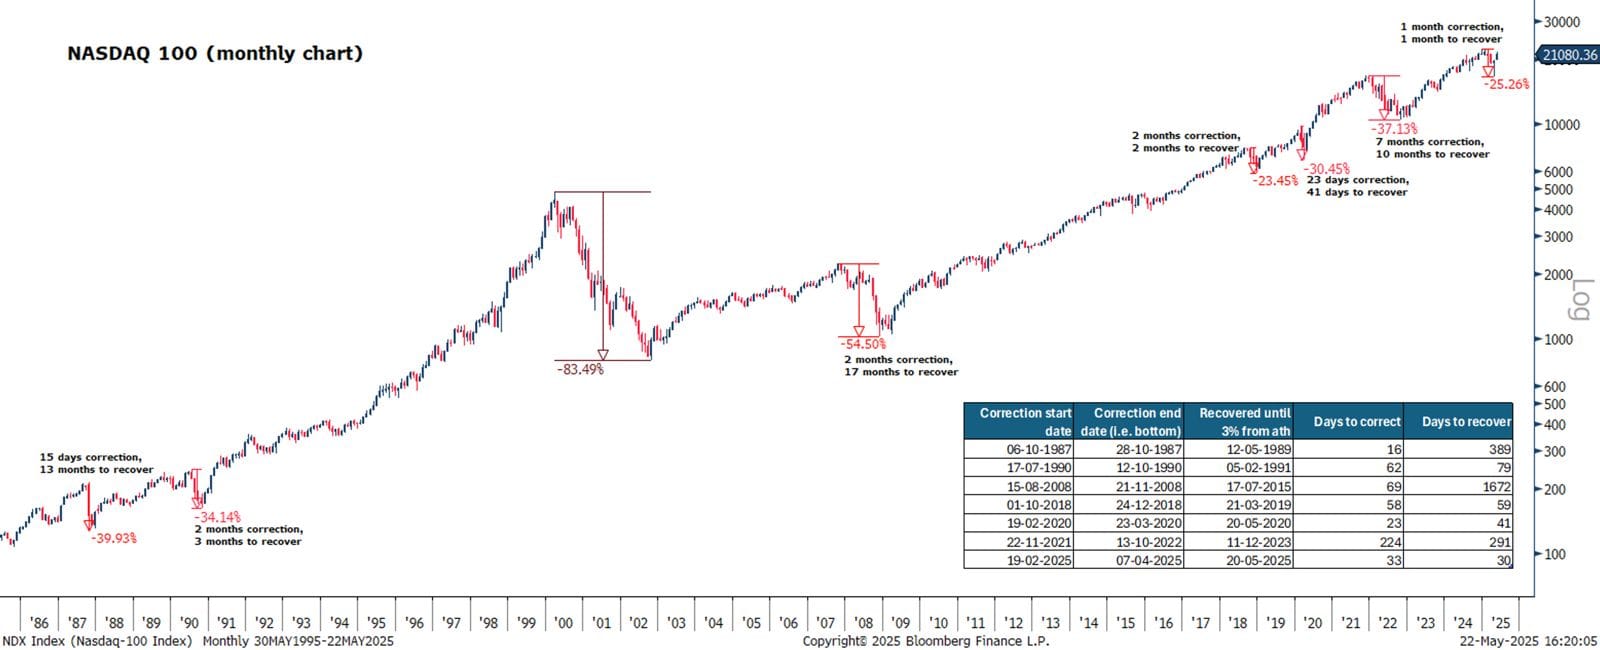
📊 What the Chart Tells Us:
- Compared to previous drawdowns like the -83.49% crash in 2000 or the -54.50% fall in 2008, which took years to recover, this time the index snapped back in just one month.
- Even the 2020 pandemic crash, which recovered in 41 days, took twice as long as the current one.
- The average historical recovery time from a 20%+ correction to within 3% of all-time highs is months to years. This one took 30 days. 🔥
📌 Key Data Points from the Chart:
| Correction Period | Days to Correct | Days to Recover |
|---|---|---|
| 2008 GFC | 69 | 1672 |
| COVID Crash (2020) | 23 | 41 |
| Current (Feb–Apr 2025) | 30 | 30 |
📈 Takeaway for Indian Traders:
This kind of V-shaped recovery is rarely driven by retail speculation alone. It reflects deep institutional buying, algorithmic confidence, and an underlying strength in tech-driven growth. For those trading Indian markets, especially in sectors correlated with global tech, this may hint at positive spillover sentiment.
💡 Replete Equities View:
“Speed matters. When markets recover faster than they fall, it’s often a clue that the worst is behind us and a new leg of the bull run may be underway.” — Sachin Sival
💹 Derivatives Data: Range-Bound but Telling
Let’s decode what smart money is doing...
🔁 FII-DII Activity (Cash Market)
- FII (Friday): ₹+1,794.59 crore
- DII (Friday): ₹+299.78 crore
📆 Month-to-Date Totals:
- FII: ₹12,191.61 crore
- DII: ₹34,497.56 crore
A rare day when both FIIs and DIIs turned buyers, the monthly trend still leans heavily toward buying.
📊 Futures & Options Cues
- FIIs added 200 short contracts in index futures, inching their net shorts up to 23,200 contracts.
- In the options space:
- 24,800 PE holds highest open interest = strong support
- 25,200 CE sees highest OI = critical resistance
📌 F&O Range to Watch:
➡️ 24,800 – 25,200
Expect a consolidation within this zone unless a breakout shakes things up.
📈 52-Week High-Low Market Breadth
| Segment | New Highs | New Lows |
|---|---|---|
| Large Cap | 2 | 0 |
| Mid Cap | 4 | 0 |
| Small Cap | 3 | 0 |
| NIFTY500 | 10 | 0 |
All green across the board! ✅
Zero new lows = bullish undertone remains firm.
🧭 Final Takeaway: A Range-Bound Market with Global Clues
The stock market prediction for tomorrow indicates a range-bound movement, especially for Nifty between 24,600 and 25,400 and Bank Nifty between 54,400 and 55,600.
While the near-term action may look sideways, macro signals like the NASDAQ 100 recovery are hinting at deeper undercurrents. Smart traders should be planning not just today’s trade, but positioning for what lies ahead.
📞 Want help preparing your portfolio for shifting market leadership or designing non-directional option strategies?
👉 Book a 1:1 Strategy Call with Replete Equities or WhatsApp us at +91-7229945555.
Disclaimer: Stock trading involves risk. This blog post is for educational purposes only and should not be considered investment advice. Please consult with a qualified financial advisor before making any investment decisions.


Comments ()